NexusFi: Find Your Edge


Home Menu


Volume Profile per candle


Discussion in NinjaTrader

Updated
    1. trending_up 5,092 views
    2. thumb_up 1 thanks given
    3. group 3 followers
    1. forum 2 posts
    2. attach_file 3 attachments


Search this Thread
  #1 (permalink)
 dyoung 
Boston, MA
 
Experience: None
Posts: 12 since Apr 2019
Thanks Given: 9
Thanks Received: 13

Hello all,

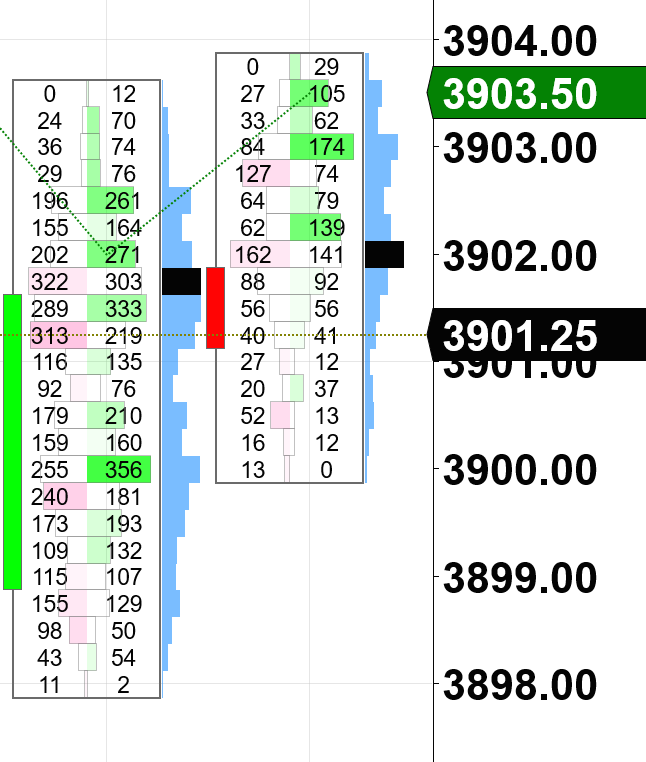
I'm currently leveraging footprint charts in ninjatrader 8, but was wondering if anyone had an indicator to assist in presenting volume profiles in a candlestick (example attached). Having a volume profile per candle would help me visually see volume distribution.

Thanks!


Attached Thumbnails
Click image for larger version

Name:	Footprint-Volume-Profile.png
Views:	786
Size:	67.8 KB
ID:	306702  
Started this thread Reply With Quote

Can you help answer these questions
from other members on NexusFi?
Netherlands & Germany Surge as World Cup Field Narro …
Prediction Markets & Event Contracts
Warsh Drops Easing Bias, December Hike Now Above 50% -- …
Prediction Markets & Event Contracts
Iran Lebanon Problem Kills Switzerland Talks, Brent at $ …
Prediction Markets & Event Contracts
Datafeed for Atas
Platforms and Indicators
Daytrading to swingtrading
Traders Hideout
 
Best Threads (Most Thanked)
in the last 7 days on NexusFi
Want your NinjaTrader indicator created, free?
5 thanks
Afternoon-close session
1 thanks
Franks Trading Journey
1 thanks
Denied 20K payouts: Alpha Futures
1 thanks
FootPrintV2 Chart for NT8
1 thanks
  #2 (permalink)
 ragic 
N. Yorks, UK
 
Experience: Intermediate
Platform: NT8
Trading: ES
Frequency: Never
Duration: Seconds
Posts: 81 since Jun 2011
Thanks Given: 48
Thanks Received: 93


I tick 'Show as Profile'
I find it useful to show the liquidity pockets, and perhaps where there is the opposite. no interest...


Reply With Quote
  #3 (permalink)
 jrobertburgoyne 
New York, NY, USA
 
Experience: Intermediate
Platform: NinjaTrader 8
Broker: InteractiveBrokers, Kinetick
Trading: ES, CL
Posts: 22 since Mar 2017
Thanks Given: 8
Thanks Received: 53


You can show the volume profile + PoC on the RHS. Light blue profile and black PoC.

Data Series, Properties, Box outline, Color for Maximum Black and Color for volume Cornflower Blue.

On 30 minute bars the volume profile fills out and the PoC moves dynamically, but I'm not sure that it's predictive or usable, TBD.


Reply With Quote
Thanked by:


Last Updated on March 23, 2021


© 2026 NexusFi®, s.a., All Rights Reserved.
Av Ricardo J. Alfaro, Century Tower, Panama City, Panama, Ph: +507 833-9432 (Panama and Intl), +1 888-312-3001 (USA and Canada)
All information is for educational use only and is not investment advice. There is a substantial risk of loss in trading commodity futures, stocks, options and foreign exchange products. Past performance is not indicative of future results.
About Us - Contact Us - Site Rules, Acceptable Use, and Terms and Conditions - Downloads - Top
no new posts