NexusFi: Find Your Edge


Home Menu


EMA Slope Histogram indicator


Discussion in NinjaTrader

Updated
    1. trending_up 740 views
    2. thumb_up 0 thanks given
    3. group 5 followers
    1. forum 1 posts
    2. attach_file 1 attachments


Search this Thread
  #1 (permalink)
 hachot 
Ljubljana Slovenija
 
Experience: Master
Platform: NinjaTrader
Broker: NTB
Trading: ES
Posts: 36 since Oct 2014
Thanks Given: 26
Thanks Received: 5

Hi would somebody be kind enough to take a look at this indicator: https://ninjatraderecosystem.com/user-app-share-download/slope-indicator-with-enhanced-options-nt8/

i would like it to look more like this one from tradingwiev: https://www.tradingview.com/script/5bBmOn2G-EMA-Slope-Histogram/

I need it to be used with 20 period EMA without any need for detrending options.

I find it very useful for determining trend and price action patterns with relation to EMA.

the indicator works find, but it would be amazing if somebody could improve it to use like 2 green and 2 red colors and simplify it and make it more like tradingwiev's one.

Ty and best regards,
Klemen


Started this thread Reply With Quote

Can you help answer these questions
from other members on NexusFi?
CFTC Rewrites the Rulebook -- Kalshi Cracks $1B Non-Spor …
Prediction Markets & Event Contracts
Rubios Good News Within Hours and the 30-Day Math: Why H …
Prediction Markets & Event Contracts
After $87M Settles NO: Irans Nuclear Redline Sets Up the …
Prediction Markets & Event Contracts
Double Deadlock: Rubio Calls Hormuz Tolls "Unfeasib …
Traders Hideout
Peace Deal Forward Curve: May 22%, June 51%, December 81 …
Prediction Markets & Event Contracts
 
Best Threads (Most Thanked)
in the last 7 days on NexusFi
NexusFi site changelog and issues/problem reporting
8 thanks
Darmok and Jalad at Tanagra
1 thanks
  #2 (permalink)
 Hiccup 
Denver CO/United States
 
Experience: Intermediate
Platform: NinjaTrader, Tradier
Trading: Equity and index options, Futures
Frequency: Daily
Duration: Minutes
Posts: 18 since Apr 2015
Thanks Given: 116
Thanks Received: 28

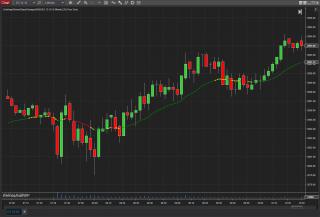
I looked at the screenshots for both indicator versions you referenced. You said you used them for trend determination, so my question is: have you considered using a moving average indicator like the named one below from the NexusFi Download Tab, which changes color when slope changes from positive to negative (see screenshot), or is there some compelling reason you must have it displayed as a histogram? The write-up for this indicator states that it can be placed in any panel, and on any time series data, so there are lots of possibilities.

ColorInputSeriesSlopeChanges

NT8 Indicator image


Reply With Quote


Last Updated on February 17, 2024


© 2026 NexusFi®, s.a., All Rights Reserved.
Av Ricardo J. Alfaro, Century Tower, Panama City, Panama, Ph: +507 833-9432 (Panama and Intl), +1 888-312-3001 (USA and Canada)
All information is for educational use only and is not investment advice. There is a substantial risk of loss in trading commodity futures, stocks, options and foreign exchange products. Past performance is not indicative of future results.
About Us - Contact Us - Site Rules, Acceptable Use, and Terms and Conditions - Downloads - Top
no new posts