Welcome to NexusFi: the best trading community on the planet, with over 150,000 members Sign Up Now for Free
Genuine reviews from real traders, not fake reviews from stealth vendors
Quality education from leading professional traders
We are a friendly, helpful, and positive community
We do not tolerate rude behavior, trolling, or vendors advertising in posts
We are here to help, just let us know what you need
You'll need to register in order to view the content of the threads and start contributing to our community. It's free for basic access, or support us by becoming an Elite Member -- see if you qualify for a discount below.
-- Big Mike, Site Administrator
(If you already have an account, login at the top of the page)
I have read his book: " The Logical Trader", and have to admit that it was a interesting read. However, I personally don't trade his system as I'm looking into shorter term trades.
I use one of his setups.. but it rarely happens... The good thing is that when it does, it makes a huge move.
What im talking about is when the market goes up and trades above the previous days high, then suddenly reverses and breaks the previous days lows.....
Statistically, it only happens about 10% of the times, but when it happens, you get a nice extended move. I believe the main reason is because most pro's don't use a 2 point stop, but instead use the days lows/highs as their stop. So when that happens, its the pro's that are getting hit, so they have to liquidate.
No way for me to authenticate it, but it does make some sense, and its a type of setup i use in my arsenal...
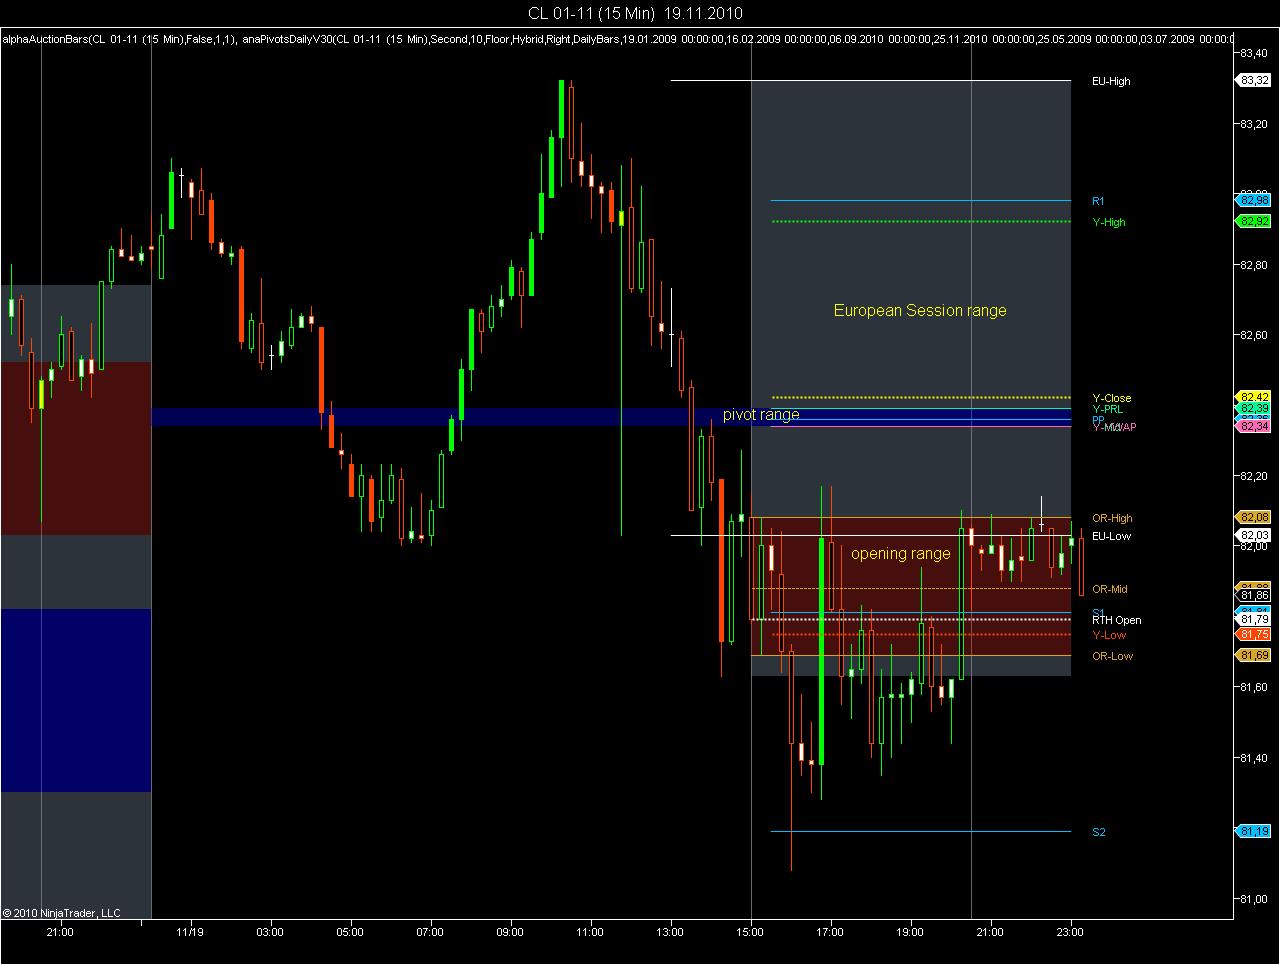
I have been inspired by Mark Fisher to code the pivot range and opening range indicators. I do not use the ACD method though.
The problem with ACD is that markets change. So Fisher is absolutely correct not to include a standard formula to calculate the A. C and D points. To use this, you would have to code an indicator that gives you the conditional probability that a breakout will continue after it has exceded a defined threshold. If you know the probabilities for different thresholds and/or the scope of the expected move, this can be exploited.
Note that a breakout is only valid, if price stays during a defined time period above or below the ACD lines.
However, I do watch the opening range and use it as support and resistance. Example below for CL, as Mark Fisher traded on NYMEX.
Many thanks for sharing this great work. Fisher's method work superb after NR7, NR4, and Inside Days off of daily charts esp in this high volatility market.
Here are links for his video from 03 and 05, ines from TL was nice enough to host them. Fisher gives a 30 day trial no CC required gives all the A,C and everything values.
Thanks for sharing. To stay with CL, Fisher seems to use a 45 min opening range and an A value of 8 ticks and a C value of 13 ticks. Not sure that these are the most recent values. If they are only updated twice per year, why should subscribers pay the subscription fee.
The point is that you need to have an idea first, whether the opening range breakout will fail or not, and how far the move could go. If yesterday was a narrow range day or a balancing day - as indicated by a narrow pivot range - this increases the odds for a succesful breakout. However if the night session range was large, the move can have taken place prior to the open and then reverse. This would result in a failed breakout.
I think it is important to monitor the daily range as well to avoid being trapped by a false breakout.
Has anyone noticed that is trading ACD, the issue of what to do when a significant narrow range day gets taken before the opening range is even set? It makes for a confusing dilemma. Which gets priority? I am finding the one which triggers first, since both are valid in volatility trading. Take the ES for example today. Per Mark's video, you would use the stock market open 9:30-9:50 ET and then 3.5 above that but high of the previous day already triggered a long off the NR7 breakout. I have seen this in other markets as well
I guess it comes down to which S/R is more relevant at what time?
If the break-out occurs during the night session, you simply missed it. The market opened exactly at the pivot level R2, so a large part of the move was over.
Now the pivot levels are calculated from the range of the prior day. As yesterday was a NR7 day, the pivot levels are still valid, but they are quite narrow. In this case I look at the average daily range of the last 10 days as a reasonable target. Because the move started during the European session I would look at the ETH range. The ETH range target was already reached prior to the open.
What was behind? Today is a large treasury auction, so prudent market participants shifted their money from treasuries to stocks to protect themselves. During the auction the large market makers support the auction, so there is no flows from treasuries to stocks.