Welcome to NexusFi: the best trading community on the planet, with over 150,000 members Sign Up Now for Free
Genuine reviews from real traders, not fake reviews from stealth vendors
Quality education from leading professional traders
We are a friendly, helpful, and positive community
We do not tolerate rude behavior, trolling, or vendors advertising in posts
We are here to help, just let us know what you need
You'll need to register in order to view the content of the threads and start contributing to our community. It's free for basic access, or support us by becoming an Elite Member -- see if you qualify for a discount below.
-- Big Mike, Site Administrator
(If you already have an account, login at the top of the page)
My advance apologies if this has been covered elsewhere, but how does one create a continuous commodity chart in NT7 with Zenfire? I understand that this is 'simulated' or whatever the terminology Ninja uses. They state it's one of their features but fail to explain how you must adjust your instrument to make use of the historical data.
Can you help answer these questions from other members on NexusFi?
A genuine continuous contract is obtained by splicing single contract months together. There are several ways of doing this. The method is chosen by your data provider. If you want to load a genuine continuous contract, you will need to use the instrument symbol followed by ##-##, for example ES ##-##. You can try this with daily data loaded from Kinetick, as they have continuous data.
Real continuous data has some pros and cons:
Pros: Suitable for investment purpose and price analysis over several years. Good for analyzing seasonality of commodities.
Cons: Cannot be used for back testing, as the rollover losses (or sometimes gains) are not correctly taken into account. Cannot be used for Fibonacci analysis, as swings are distorted.
When merging single contracts, you simply switch from the old month to a new month on rollover date. The close prior to rollover data is the close of the old front month contract. The open on rollover date is the open of the new front month contract. This means that on your chart
- data will gap up, if the market is contango
- data will gap down, if the market is in backwardation
This type of dataseries can not be used for backtesting either, as it will not correctly show profits and losses that result from positions that you hold during the rollover of the contracts.
NinjaTrader allows you to create merged contracts with a gap. First select appropriate rollover dates, which can be done under instrument settings: Edit instrument -> Misc -> Contact months -> Click the right field with your mouse. For financial futures the rollover dates are already preset correctly, for commodities the rollover dates are mostly false. Also make sure that all your instruments are set to Merge Policy "UseGlobalSettings". Second go to Tools -> Options -> Data and select Merge policy "MergeNonBackAdjusted". All your charts will now automatically use data from several contracts by switching on rollover date. You will notice the gaps.
Merged Backadjusted Contracts
My preferred way of displaying intraday data is to use MergeBackAdjusted Futures. There are two ways of backadjusting: One method is to add the gap to the old contract thus horizontally shifting all data prior to the last rollover date. The other, more exotic method is backadjustment by using a ratio.
Merged backadjusted contracts also have pros and cons:
Pros: They do not show any gap on rollover date, so you can use them for backtesting. Also the swing sizes are not distorted.
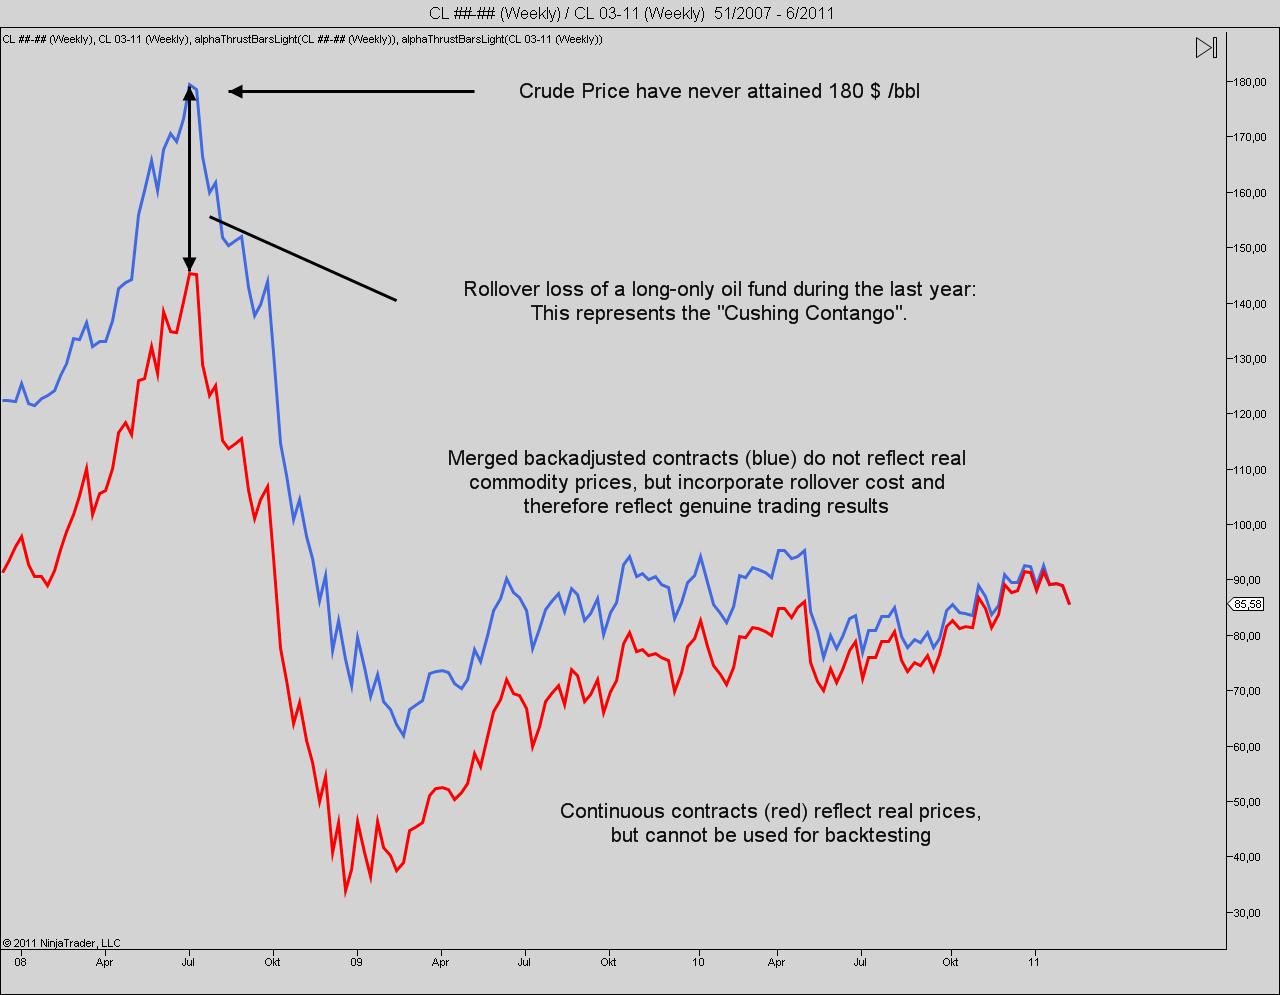
Cons: You cannot use them over longer periods, say several years, as they will no more reflect absolute prices. This is particularly true for futures that are monthly rolled. For example if you take crude oil and you create a backadjusted contract, you will see oil prices of 180 $/bbl for July 2008.
The chart below shows the difference between a continuous futures contract (red) and the merged backajdusted contract (blue). The continuous contract follows real commodity prices, the merged backadjusted contract shows the value of the assets of a long only oil fund that has chosen to roll monthly. The difference between the blue and the red curve is the sum of the rollover losses of a long only fund. So if you are an oil fund, you better invest your money in IPE traded Brent futures,
and also you may want to find a way to roll every tow months only to reduce the losses.
With NinjaTrader you can create a merged backadjusted futures contract by entering the correct rollover dates and by setting the merge policy to "MergeBackAdjusted" under Tools -> Options - > Data. Once you did this, you should check,whether Ninjatrader has calculated the correct offsets. This can be done under instrument settings. if the offsets are false, you can change them manually.
In NT, if want to use NonBackAdjsuted for CL, and Add future months in Instrument Manager, an set merge policy, then how do I refer to the contract then? with ##-## format, or do I still need to change the contract name every month? Can I still look at just the specific month by using the mm-yy format?
The ##-## contract is provided by your data provider. You can consider it as a different instrument, similar as a stock. The merge policy has no impact on this instrument.
If you want to display a NonBackAdjusted contract just for CL, but not for other instruments, you can go to the instrument manager and select CL's merge policy accordingly. Now, you if you refer to CL 03-11, which is the current contract month, CL 03-11 data will be displayed back to the last rollover date (around Januaray 20), then extended with CL 02-11 data back to the prior rollover data (around December 20), then extended with CL 01-11 data etc.
If you want to look at the specific month as well you can do so, but you will need two different charts:
(1) Set CL's merge policy to MergeNonBackAdjusted in the instrument manager, then open a chart for CL 03-11. Leave that chart open.
(2) Now go back to the instrument manager and change the merge policy to DoNotMerge. Open another chart for CL 03-11.
You should now have two charts, one with non-backadjusted merged contracts, and one with the single CL 03-11 contract. As far as I know it is not possible, to display a merged and a not-merged contract on the same chart.
I wanted to know if I could get the ##-## functionality with the NT features, mainly because I don't want to have to keep track of rollover dates, and change the CL contract every month on the chart. I think what you are saying is that is not possible withing NT, even if I set a merge policy that applies only to historical data, and I will still have to change to the new contract every month around rollover date.
NT cannot build a real continuous contract from single month contracts. NT can only display a continuous contract as ##-##, if it is supplied by your data vendor.
NT can merge contracts, which needs the prior selection of an appropriate rollover date and display the merged contract either with a gap on rollover day, or with a backadjustment which offsets the gap.
For all financial futures the correct rollover- dates are preset, so all you need to do, is to switch to the new contract on rollover day. For most commodities it is more work, as you will have to determine rollover buy using a rule such as volume crossover or open interest crossover and then enter the rollover date manually.