Attached is a function to print text easily on a chart, from a indicator OR signal.
Prints Text or a Special Character (WindDing) at a certain Date&Time.
The font Size, position (relative to the current bar) and color can be set.
The text can be either written in a horizontal format or a vertical format.
Note - This function can be used within Signals. Greatly enhancing the veiwing of signal opeartion.
The special characters already defined are -
- Arrows Up,Dn,Left,Right, and in between ie Arrow in a North West direction (ArrNW)
- Triangles Up, Dn, Left, Right both in a Solid and Hollow form.
Examples
PrintText_S(date,time_s,High+3,1,2,black,15,True,"SHORT",False); // "Short" is written Vertically above the price
PrintText_S(date,time_s,ExitLevel,2,2,blue,10,False,"BE",False); // "BE" is written horizontally
PrintText_S(date,time_s,Low-4,2,2,DarkGreen,10,False,"TriHollowDn",True); // Display a Hollowed triangle
Note - The time input requires seconds ie 123456, which equals "12:45:56"
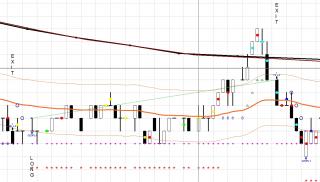
In the attached image, you can see - The O represents a trailing Stop Order,
vertical text, show the actual Entry and Exit. Red * indicating the trade StopLoss, moving to B to represent that the trade is now at a breakeven, and Green Triangles to represent the trailing stop.
All of these are drawn within the signal and actively show the orders as the trade progresses.
Another sample of the text and drawing can be seen here
https://nexusfi.com/
In this one, I use a green triangle to show that I'm in a trade and above it, I have a two letter description of the state of the exit. ie IS (Initial Stop/StopLoss) BE (Breakeven), PA (PriceAction Stop), TS (Trailing Stop), BM (Big Mother bar) etc.
Neil.
Category MultiCharts
|
|
|


