NexusFi: Find Your Edge


Home Menu


5 period Daily Moving Average in Multicharts


Discussion in EasyLanguage Programming

Updated
    1. trending_up 1,713 views
    2. thumb_up 0 thanks given
    3. group 3 followers
    1. forum 1 posts
    2. attach_file 1 attachments


Search this Thread

5 period Daily Moving Average in Multicharts

  #1 (permalink)
 ilu007 
New York + US
 
Experience: Intermediate
Platform: MultiCharts
Trading: Indian Stocks
Posts: 37 since Aug 2015
Thanks Given: 10
Thanks Received: 2

Dear Member,

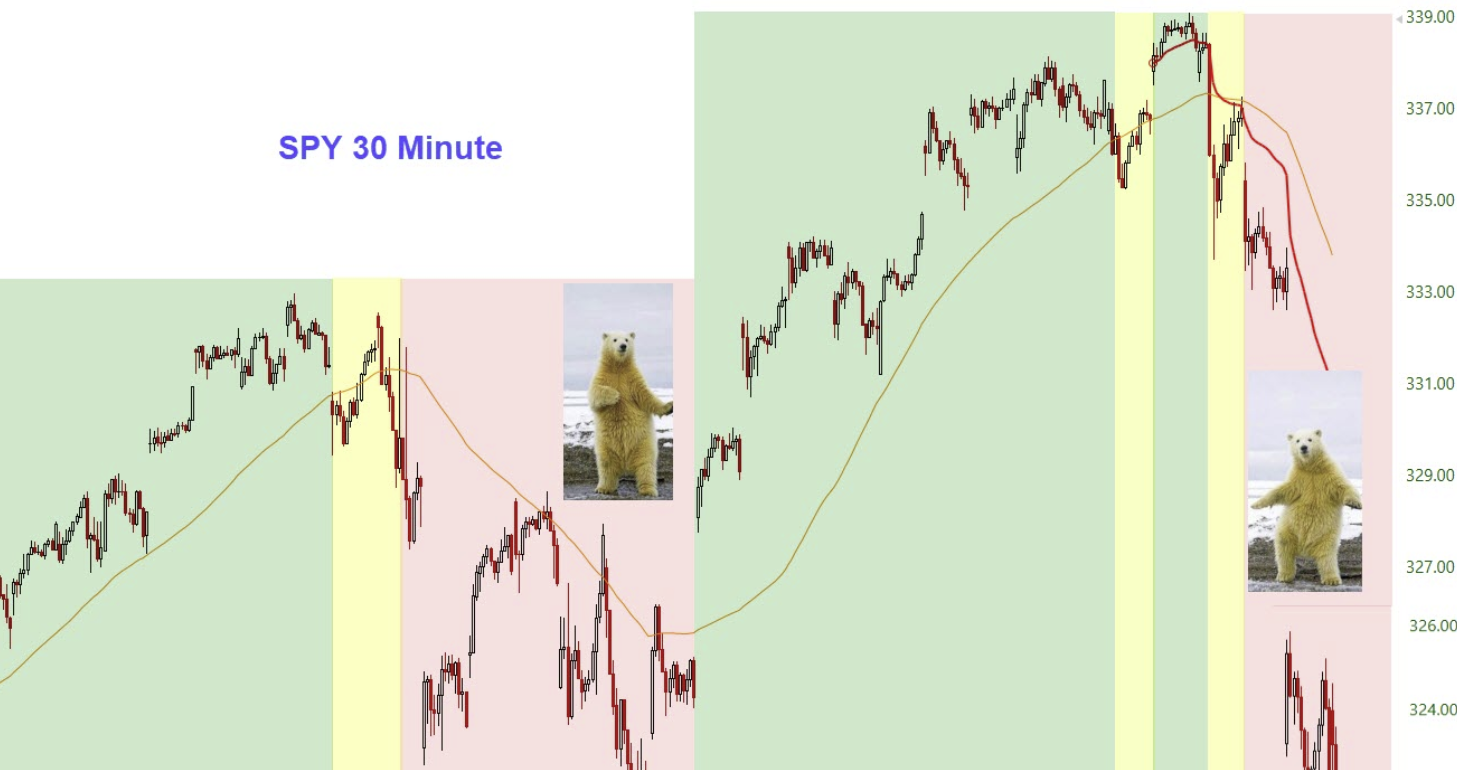
I am trying to plot 5 period Simple DMA (Daily Moving Average) on 30-min time frame, but I am unsuccessful in doing so.
Also, If anyone could help me in drawing a simple trend recognition background.

If 30-min prices are below 5 DMA then the background color is Red.

If 30-min prices are above 5 DMA then the background color is Green.

If 30 min prices is above or below 5 DMA but didn't got out previous swing high/ low then color is yellow.

I am attaching a screenshot .
Started this thread Reply With Quote

Can you help answer these questions
from other members on NexusFi?
ZombieSqueeze
Platforms and Indicators
Trade idea based off three indicators.
Traders Hideout
Option : Call and Put increase at same time ?
The Elite Circle
What broker to use for trading palladium futures
Commodities
Pivot Indicator like the old SwingTemp by Big Mike
NinjaTrader


Last Updated on February 29, 2020


© 2024 NexusFi™, s.a., All Rights Reserved.
Av Ricardo J. Alfaro, Century Tower, Panama City, Panama, Ph: +507 833-9432 (Panama and Intl), +1 888-312-3001 (USA and Canada)
All information is for educational use only and is not investment advice. There is a substantial risk of loss in trading commodity futures, stocks, options and foreign exchange products. Past performance is not indicative of future results.
About Us - Contact Us - Site Rules, Acceptable Use, and Terms and Conditions - Privacy Policy - Downloads - Top
no new posts