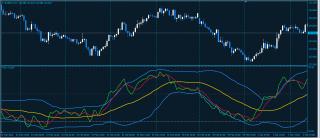
A comprehensive but helpful indicator that uses RSI (Relative Strength Index), its moving averages, and volatility bands (based on Bollinger Bands) to offer traders a full picture of the current market situation.
Input parameters
RSI_Period (default = 13) — period in bars for calculation of RSI. Recommended range is 14 or 21.
RSI_Price (default = PRICE_CLOSE) — price type to use in RSI calculation.
Volatility_Band (default = 34) — period in bars for volatility bands calculation. Recommended range is between 20 and 40. The lower the value the more sensitive the band.
StdDev (default = 1.6185) — standard deviation multiplier for volatility bands. It is not recommended to change this parameter.
RSI_Price_Line (default = 2) — period of the first moving average (fast) of RSI.
RSI_Price_Type (default = MODE_SMA) — type of the first moving average of RSI.
Trade_Signal_Line (default = 7) — period of the second moving average (slow) of RSI.
Trade_Signal_Type (default = MODE_SMA) — type of the second moving average of RSI.
For scalping, enter long when the green line is above the red line and enter short when the red line is the above green line.
For short-term trading, enter long when the green is above both the red and the yellow lines; enter short when the red one is above both the green and the yellow ones.
For medium-term trading, go long under the same conditions as for the short-term trading but only when all lines are below 50; to go short — the same but above 50.
Mind the blue volatility band as it points to the long-term trend strength and volatility when wide. Steep green line changes also signal short-term market volatility.
Category NinjaTrader 8 Indicators and More
|
|
|
