I have uploaded a new indicator, RVOL (relative volume), that has accurate calculations in it, based on my manual gathering of values and performing the calculations. You can find it here:
https://nexusfi.com/local_links.php?action=ratelink&catid=27&linkid=2207
If I figure out what's wrong with this one, I'll upload a repaired version. In the meantime, please use the RVOL indicator mentioned above.
Thank you!
*******************************
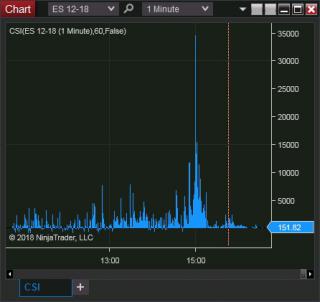
This indicator is inspired by Pete from JigSaw Trading. He likes to call it the Cumulative Sheep Index, but it actually compares volume on the current bar to the average volume for the same time of day, calculated over the last X number of days.
You can set the number of days and use it on bars of any duration. I have no idea what it will do with non-time-based bars, so be prepared for it to blow up, if you try that.
Please be aware that the smaller the bar duration and the larger the number of days being averaged, the longer it'll take to complete the plot. 1-min bars and 60 days, for example, take several minutes to complete.
There is an option to have some of its data sent to the Output Window, so you can assure yourself it's working, in case you choose bars and days that take a very long time to calculate.
Yours to download.
(In answer to the question posted in the 2nd 'thanks', yes. The values in the right column show the difference in volume between the current bar volume and the average volume for that bar for the previous X number of days.)
Category NinjaTrader 8 Indicators and More
|
|
|


