The exercise was time consuming and not that helpful over the long term which lead me to abandon the project, until recently when I revisited the idea using NT-8.
The different period settings I used for the original project (on a Daily chart) were 10, 25 and 35 (Days),
and (on a Weekly chart) were 2, 5 and 7 (Weeks).
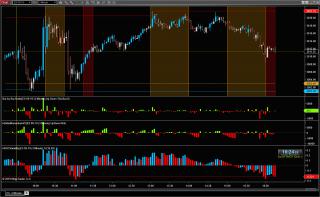
The irROCVolatility indicator displays the average of three different (10, 25, 35) ROC (Rate-of-Change) indicators to assist in highlighting directional bias while indicating increases and decreases in Volatility.
I was surprised by the way the indicator works on the smaller Intraday time frames that many of us use as day traders.
I find it helps when I can't understand what Delta is trying to tell me. Hopefully you'll find it useful too.
Trade well
Category NinjaTrader 8 Indicators and More
|
|
|
