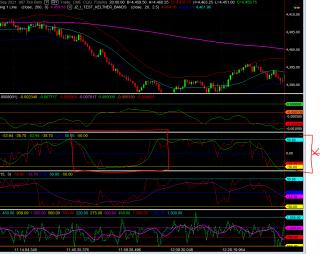
The goal of normalization is to retain any predictive value of an indicator that gains its importance from its current value relative to recent values. This normalization process imparts stationarity on the indicator. From the text, "In most case, stationarity improves the accuracy of predictive models. (Recall that, roughly speaking, stationarity means that the statistical properties of an indicator do not change over time.)".
The attached function is in easylanguage syntax. It should be able to take any raw indicator value and normalize it by both centering and scaling it within a range of +50/-50.
Attached is a text file of the easy language code.
I hope you find this useful.
Updates:
08/15/2021 v001 - corrected the function name return value to the name of the text file
Cheers,
JZ
Category MultiCharts
|
|
|
