This is the HARSI indicator, requested in THIS thread.
This indicator is a port from TradingView. This indicator was originally created by a gentleman named JayRogers. If you want more info on this indicator, go HERE.
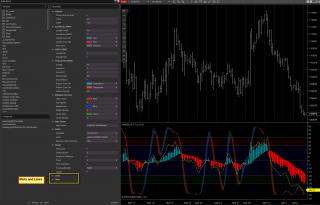
Most of the items in the settings should be self-explanatory.
The customization for the horizontal lines, and plots are near the bottom of the UI, if the styling or levels need to be changed.
The Stochastic Ribbon(blue/red lines) is disabled by default. If you use the ribbon, and the ribbon is taller than you want, you can use the "Stoch Scaler" input to scale it to a percentage of its normal size.
The RSI histogram is the same as the regular RSI(yellow line), so the histogram is also disabled by default.
For coders interested in pulling the HA levels for strategies... The bars are created within onRender(), so there is no actual object for the bars on the chart. There is however, and exposed data series for the OHLC values of the HA bars. The four individual data series are called, openHA[0], highHA[0], lowHA[0], closeHA[0] respectively.
NOTE: Installing this indicator will create a folder called "BTMM," that's where the indicator will be.
---EDIT - V2 13May2022---
*Added Null/Bars check to OnRender() method.
*Removed logic to attempt to automatically set the LINES for the Stochastics to transparent, when using 'ribbon' mode for the Stochastics. This might cause error in the case a user switches back and fourth.
Category NinjaTrader 8 Indicators and More
|
|
|


