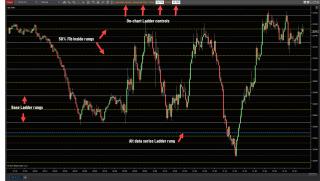
The dpLadder is a swing-based indicator. But what is a swing? It’s a place where price has had a change of heart. I wondered what a chart would look like if, between swing-points, I plotted Fibs. I’m sure many of you had the same thoughts and I decided to automate it. Add the Ladder to your chart. It will automatically use two recent swings as the high and low and plot a Fib between them and will then propagate the ‘rungs’ of the ladder above and below those two swing-points while plotting Fibs between the rungs.
The indicator also has the ability to use a second timeframe and repeat the ladder-building process. So, while my chart may be a 1 minute, internally the indicator can be using a 30-minute data series to plot wider swings and therefore a second set of Fibs. All the Fib lines are color/style/thickness/opacity adjustable.
The controls for the indicator are placed on the chart for fast access. The ‘dpLadder Update’ button will cause the indicator to look for new swing-points. The ‘Show-Hide Fibs’ button will hide the ‘internal’ Fib lines while keeping the primary swing-points, the 0% and 100% lines, which make the rungs of the ladder. The ‘PriceL’ and ‘PriceH’ input fields allow the user to manually choose the swing-points and the indicator will then redraw the chart with those points as the basis for all ladder rungs and Fibs. Input for those fields is entered from the right side.
Category NinjaTrader 8 Indicators and More
|
|
|
