**Key Features:**
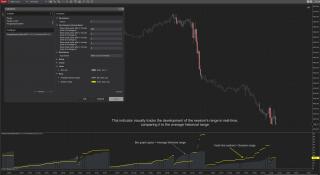
1. **Real-time Range Monitoring:** The indicator continuously tracks the development of the trading session's price range as it unfolds, allowing traders to stay on top of price movements as they happen.
2. **Historical Range Comparison:** Gain a competitive edge by comparing the current session's range to historical averages. This valuable perspective helps traders identify potential overbought or oversold conditions and assess the significance of price movements.
3. **Visual Clarity:** The Session Range Tracker Indicator presents information in a clear and intuitive visual format, making it easy for traders to spot trends and anomalies at a glance.
4. **Customizable Parameters:** Tailor the indicator to your specific trading strategy with customizable parameters, such as the look-back period for historical range comparisons, reset the range meter at various intervals and visual style preferences.
**How It Works:**
The RangeDisparityMeter Indicator calculates the price range within the current trading session (Yellow Hash Line) and overlays it with historical range data (Gray Bar Graph). By doing so, it provides a visual representation of whether the session's price movements are within the expected norm or deviating from it. This information can be instrumental in identifying potential trading opportunities and risk management.
There is an open thread if you'd like to discuss or report a misbehavior:
Category NinjaTrader 8 Indicators and More
|
|
|
