It is fully property-controlled, but I must state that the 'guts' of the indicator, the numeric DPO/ADX parameters (DPO especially) should be left alone as they are time-tested values that were determined by folks much smarter then myself.
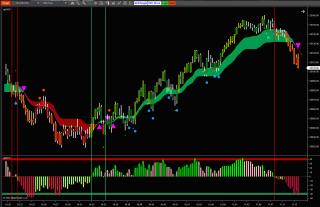
The picture is of the 500 Tick NQ with my dpQGP and dpDPO applied to it. You'll notice that the bright outline very often appears after breaking out of a congestion area or bar formation. You'll be surprised with how many ways you can use this.
As you experiment with many of the properties, you'll be able to fine-tune it to your style. But be wary of changing the 'Parameters' and 'Combo-Signals' sections.
If you find the the two 'warning track' lines, above and below the histogram in my picture, are sitting on the zero line on your chart, adjust the 'LineOffset' property to a value that approximates the highs and lows of the histogram. For a 1min CL, it might be .2, but for a 5min ES it might be 100, so play with it.
You can alter the bar-body outline by changing the color of the 'StrongUp' and 'StrongDown' properties. I like yellow on a black background or magenta on a white.
The dpXRAY, (very slick if I say so myself) was packaged together with the dpDPO by accident! Use it as an overy lay of a volume panel or ADX panel. You'll 'see' what price is doing internally, hence the 'xray' name.
As always, comment or concerns are always welcome. You can get me directly at [email protected].
Good trading!
Dave P.
Category NinjaTrader 8 Indicators and More
|
|
|


