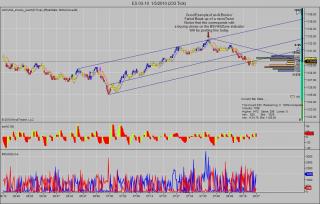
This is the first version that uses a line rather than bars. I suggest overlaying it with Volumn (not shown in my tick charts), as bars. Blue represents buying and Red Selling based on the price vs. the last bar. An example is shown below where it is used in conjuction with ADXVMA_sharky_paint & Bill Williams' Acceleration/Deceleration Oscillator (from NinjaTrader).
In the attached figure there is a buying climax that preceeds the Failure of a Al Brooks described (Chapter 2) micro trendline BreakUp and the maximum of the DOM for the morning. This is confirmed by a decrease in the Williams Acceleration Oscillator. All indicating that this rally has run its course.
COMPATIBILITY:
NinjaTrader 6.5: YES
NinjaTrader 7.0: NOT TESTED [feedback]
Category NinjaTrader 6.5 Indicators
|
|
|


