Welcome to NexusFi: the best trading community on the planet, with over 200,000 members Sign Up Now for Free
Genuine reviews from real traders, not fake reviews from stealth vendors
Quality education from leading professional traders
We are a friendly, helpful, and positive community
We do not tolerate rude behavior, trolling, or vendors advertising in posts
We are here to help, just let us know what you need
You'll need to register in order to view the content of the threads and start contributing to our community. It's free for basic access, or support us by becoming an Elite Member -- discounts are available after registering.
-- Big Mike, Site Administrator
(If you already have an account, login at the top of the page)
Does anyone know of an indicator or know how to code one for the daily range. I'm looking for one that computes the daily range of whatever futures contract I'm looking at and displays it like volume in histogram form at the bottom of the chart.
Thanks,
Jeremiah
Can you help answer these questions from other members on NexusFi?
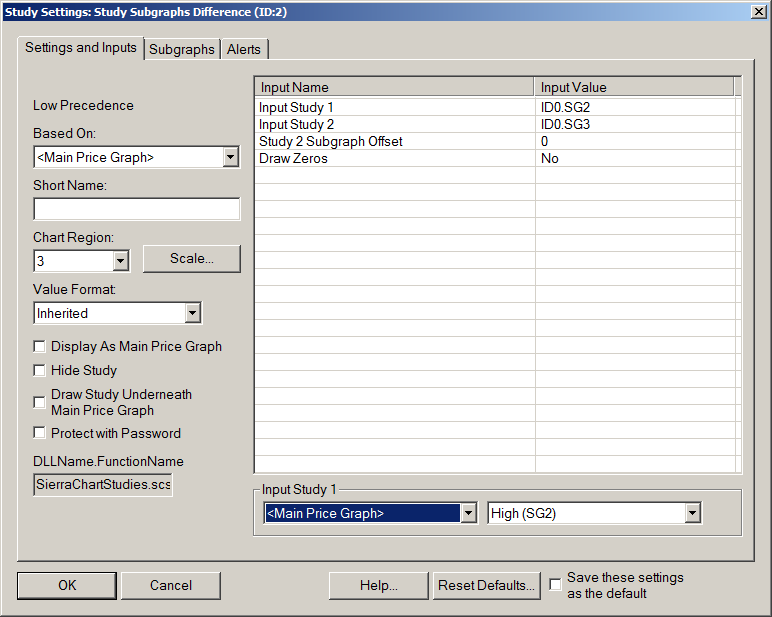
If using this on a daily chart, you can use the built-in Study Subgraphs Difference study with no coding required. Set the inputs to the high and low, and set the subgraph to bar, and you're good to go.
For things like this, I have only ever had to code maybe 2 or 3 studies, because SC has so many built-in tools to help studies talk to each other, that most anything you need is already there.
I see how many earlier language could be interpreted differently, sorry about that. What the study does is subtract the bar low from the high, yielding the range. So I meant that if you intended this to be for a day's range, then each bar would have to represent a day, so your 405 minute bar would be just fine.
This is in contrast to, if you were using 10 minute bars, for example, and wanted the running daily range at the bottom. In this case you could use the "Daily OHLC" set to the appropriate settings (to display historical high and low), and again use the Study Subgraph Difference to reference the Daily OHLC's high and low to get a running range for the current day regardless of the time frame of the chart.
Incidentally, in the chart settings, you can use a "1-0-0" setting to also see 405 minute bars, provided that your session time is 9:30:00 to 16:14:59. It is not different as far as I can see, but it is another option, and I like how it displays "1 day" on the region data line instead of "405 minutes."