Welcome to NexusFi: the best trading community on the planet, with over 150,000 members Sign Up Now for Free
Genuine reviews from real traders, not fake reviews from stealth vendors
Quality education from leading professional traders
We are a friendly, helpful, and positive community
We do not tolerate rude behavior, trolling, or vendors advertising in posts
We are here to help, just let us know what you need
You'll need to register in order to view the content of the threads and start contributing to our community. It's free for basic access, or support us by becoming an Elite Member -- see if you qualify for a discount below.
-- Big Mike, Site Administrator
(If you already have an account, login at the top of the page)
No, not specificaly. Just curious about input. An indicator is the only thing we have, even chart candles are 'indicators". Something visual to support our inerpretations. Or at it's base, a visual representation of price in time. Without something like that we would be truly trading blind.
Can you help answer these questions from other members on NexusFi?
actually all they combined give you a more "visual representation of what is going on". Leaning on one of them would be just similar to trading blind in "their" respect.
1) I never really tried MP. Skipped over to Volume Profile after having seen Steidlmeyer's (sp?) recent presentation on VP. I think it's great for target and general s/r levels. Good set on daily and with most any type of aggregation.
2) VWAP is the dynamically changing VPOC of VP. FatTails had a great futures.io (formerly BMT) webinar on it and has recently updated his famous sessionDailyVwap V40 . It's great as a magnet, target and as a general ma. Also the standard deviations based off of the VWAP are good target and resistance areas.
3) IB , maybe helpful for getting a sense of the type of day. Corey Rosenbloom had a great futures.io (formerly BMT) webinar showing use of it. I like to use FatTail's IB indicator.
4) Footprint/ T&S - I'm still new with it. I've heard from DionysysToast and others that it can be used for 1) scalping like a pit trader, or 2) using it as another confirmation along with one's other trading methods when price is at or near an indecision point i.e. s/r, level, entry point for a method.
Why not watch all the Volume Profile webinars on nexusfi.com (formerly BMT), and then also use the main Volume Profile and Footprint discussion thread:
I felt that we needed a thread dedicated to the discussion of Volume Profile.
Some basics, you can hover over these and click on most of them to get more info in the wiki. I also encourage you guys to improve the wiki articles by editing …
Market profile is for visual structure and used to determin how smooth trading was and is used to track value and balance and the markets power
Vwap is for trade location and developing value on the day and helps determin balance and imbalance
IB is market generated information and is important to the trading days structure
The foot print is amazing for reading order flow and help determin very actuate trade locations
All used together with the correct understanding you have a very very powerful edge to work with the big money in the market
" I will follow my rules, I will take my stops, I will be disciplined and i will work with the market....NOT AGAINST IT! Professional mind control is the key"
Market Profile is used to define market valuation by value instead of cost. What is value? In simple terms, value can be defined as the relative attractiveness of different price levels as defined by active market participants. There exist other ways to represent fair value than the conventional Market Profile.
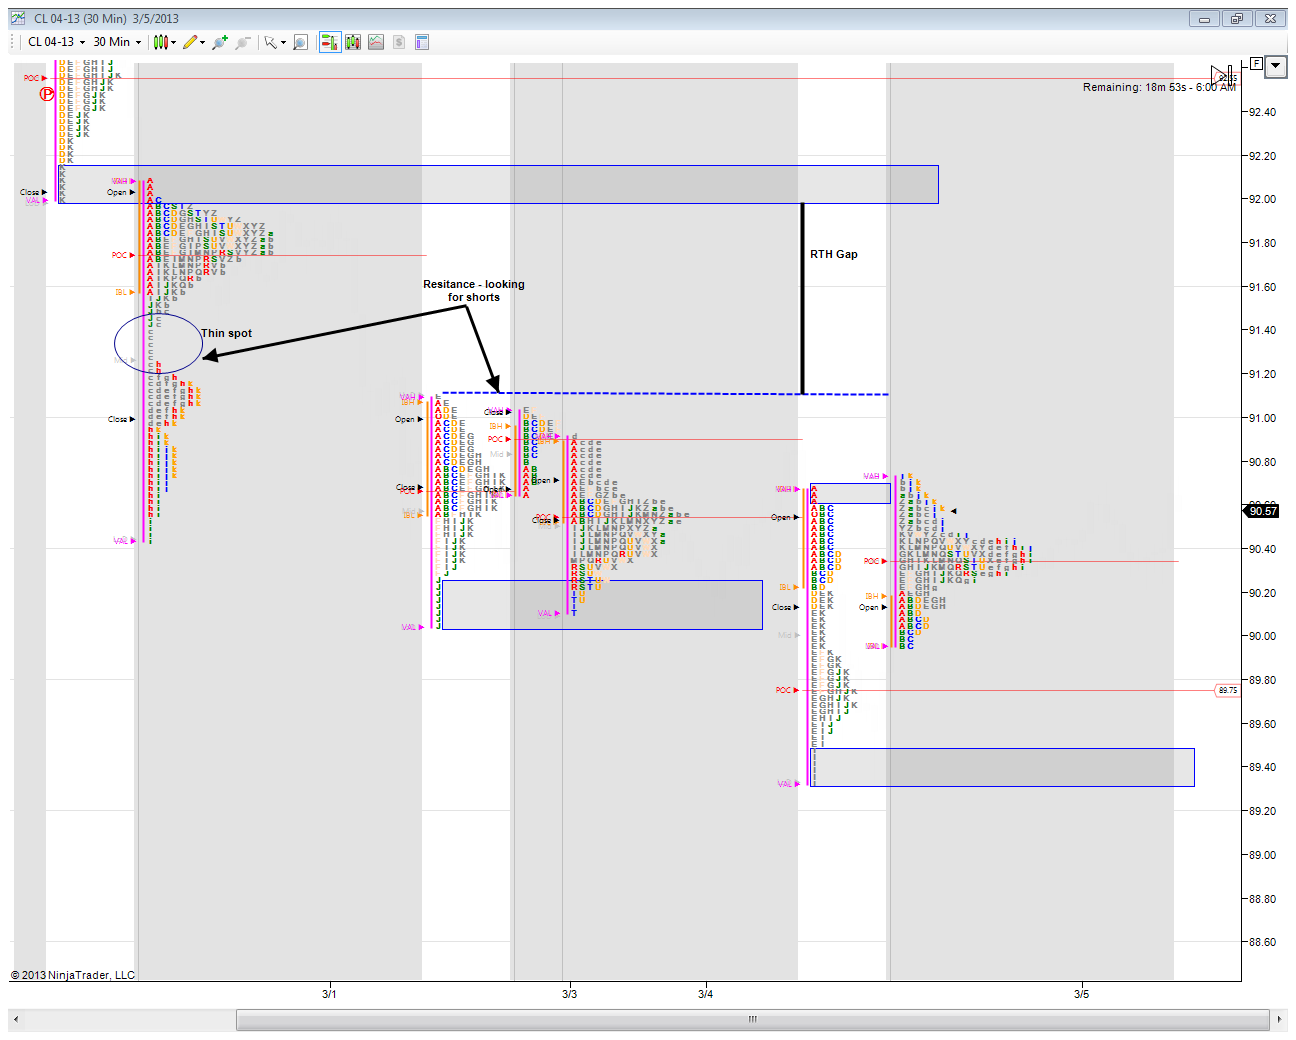
My take (note: I'm a rookie). The ON session has been working the small excess high from yesterday's RTH. I don't know if that negates that as a resistance area or not. I'll be looking for an initiative buying test of that at the open, with a target of around 91.10 (HOD from the 1st). I will also be looking for shorts at that level should price make it there and stall.
We will probably open withing range and value. We are currently at the POC of Friday's session, which was very balanced.
On the downside, I'll look to go long at the single prints from yesterday, around 89.40 - 89.30.
" I will follow my rules, I will take my stops, I will be disciplined and i will work with the market....NOT AGAINST IT! Professional mind control is the key"
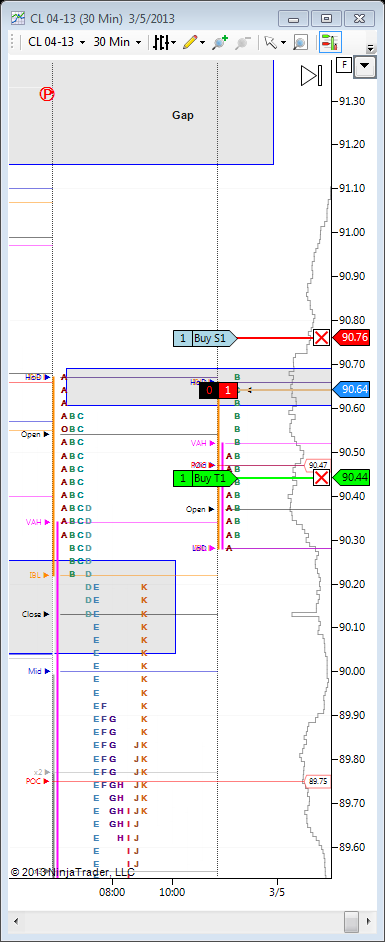
Thanks, but my soft, furry, grey balls got the better of me. When price bounced off 90.50 (the scene of the break out), I tightened my stop and only made 4 ticks on it. Noted my weakness in the journal and will work on it.