Welcome to NexusFi: the best trading community on the planet, with over 150,000 members Sign Up Now for Free
Genuine reviews from real traders, not fake reviews from stealth vendors
Quality education from leading professional traders
We are a friendly, helpful, and positive community
We do not tolerate rude behavior, trolling, or vendors advertising in posts
We are here to help, just let us know what you need
You'll need to register in order to view the content of the threads and start contributing to our community. It's free for basic access, or support us by becoming an Elite Member -- see if you qualify for a discount below.
-- Big Mike, Site Administrator
(If you already have an account, login at the top of the page)
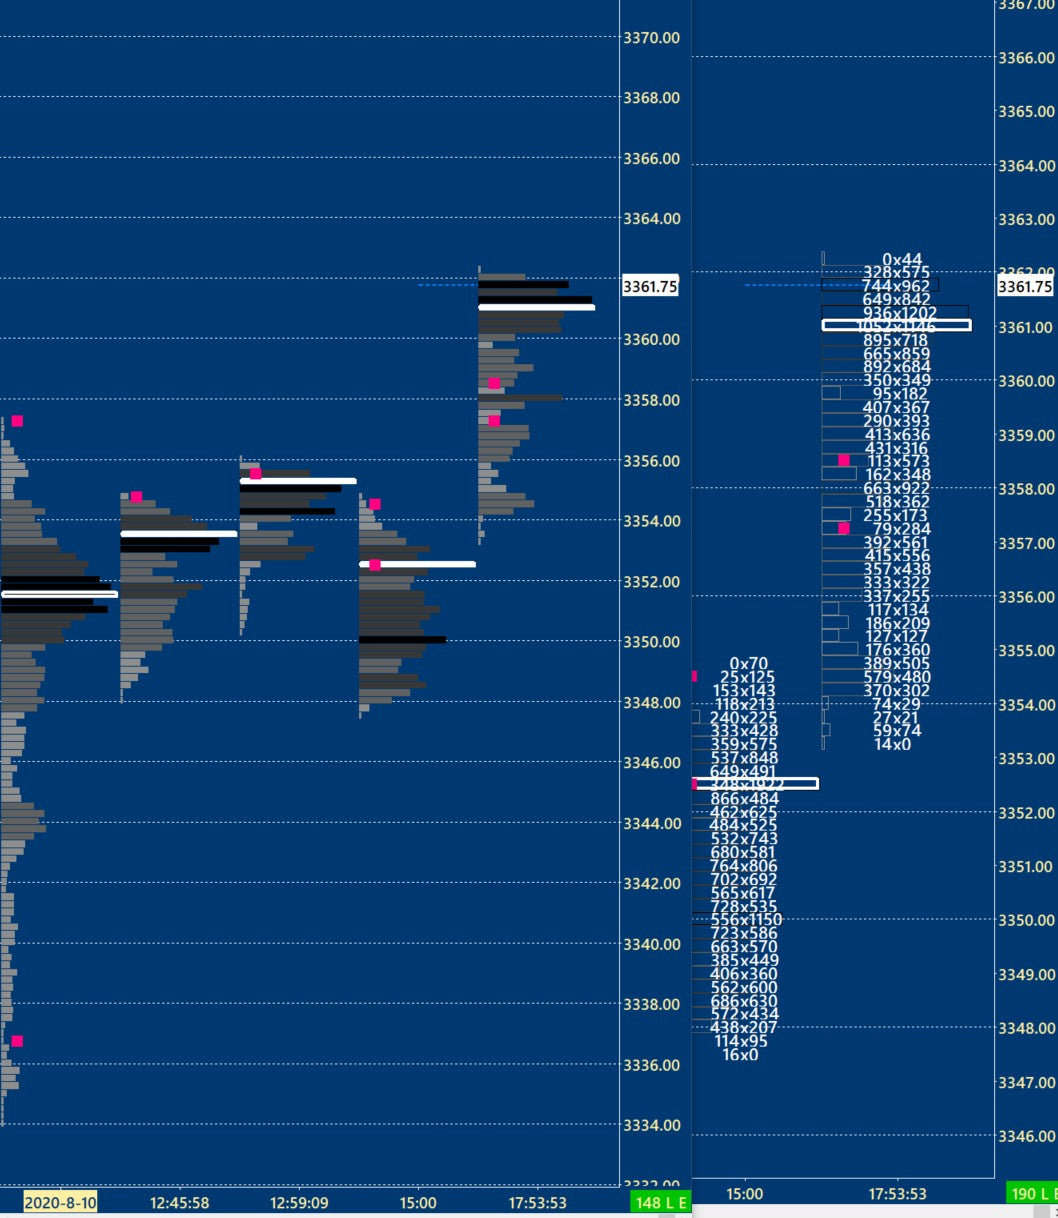
>"Footy" with the profile on the left chart & bid vs ask on the right. (Shows volume at price)
This view I call my lower timeframe and its very helpful. (I use 3 timeframes: daily market profiles + "my trading time frame": renko bricks + "LTF")
>Nuggets:
*The white line is the point of control (most volume in that footprint).
*The black lines are the highest volume, lighter color = less volume.
*Sometimes you can see absorption which is sometimes a temporary top or bottom. Using numbers footy you see price moving up then plateauing, there's a 0X300 bid/ask at 3361.25 for example, and then price goes down a few ticks, comes back up for another test and then it changes to a higher value like 0x500, somebody just absorbed 200 contracts. (its not a guarantee price would go down in that situation, it could be getting absorbed for another move up, do a fakeout, etc . it supports trade ideas)
*Imbalance is when you see something like 200x600 , 487x163, (I set the pink dots for 300% on the bid or ask, some people prefer 200%)
So if you're looking for accumulation or distribution at a certain level, footy confirms if a lot of volume is transacting which could support your current hypothesis for the next move. Low Volume Nodes also provide valuable info to me as they can often be a resistance area.
>Other need to know -- This info works better for me on the ES and not as well in less liquid markets like NQ, YM, RTY, (less liquid because there isn't a high amount of orders at each price level). (Eurostoxx is also high liquidity). Perhaps my skill at reading the less liquidity markets will improve but for now I'll take the easier path.
I dont look at doms, no thankyou. Trading is my zen practice, I dont need all the flashing lights.
I found your posts very interesting. I do a lot of research on the side. There's a lot of opportunity for a good developer to come up with a new platform that captures much of what you are talking about. I'm not nuts about Ninja but I use it along with Jigsaw, doing my own analytical work in Excel. Bookmap has some advantages but in the end, I preferred my own setups.
I don't trade the NQ but I've watched the order flow. I've never come to any other conclusion except that it's a complete fraud - spoofing, pulling/placing order, crap all over the DOM. Market profile not much better. I did find that Ninza's Volume Delta was helpful to identify impulse trades (actually you gave me a good idea to study - the 1 hour long or short using volume delta). Tried to do it in sim but in the end always gave it back.
I've been doing quite a bit of programming work, and I'm coming to a similar place. I think to really do what I'd like I will need to plug into the Rithmic API directly. A lot of what has been discussed in this thread would benefit from MBO data.
Yes, you are correct when you suggest that the Depth of Market is a "dumpster fire with intent to deceive" or something like that. Spoofing is one of the Major techniques used, which prevents anyone from "eyeballing the DOM" and getting any useful information out of it.
So when you Analyze Quote Sizes on a specific Price; the very first thing you want to do is to defeat most of the Spoofing. Here's a Hint: If MM really wants to transact with the Retail population of traders; then MM will not "pull" quotes, but will maintain them in order to gain the "FIFO matching engine advantage". So, watching the MINIMUM sizes advertised (perhaps for only a few milliseconds) versus the AVERAGE or MAXIMUM values; is the key to getting a Proxy for the concept which estimates MM's "eagerness" to transact with the Retail Market.
By using these "size minima" you can then begin to look at the DISTRIBUTION of Quoted Size near the Market. You'll find that the Distribution of Volume Weighted Price, expressed in a snapshot as "delta ticks (tiers) from the inside market" will be CLOSER to the Market on the SIDE WHERE YOU WILL PREDICT THAT PRICE IS MOVING.
iN SIMPLISTIC TERMS: "When they really want to 'pull the inside market' to their Quote, then they will hold the Quote stable; and will Distribute their Quoted Sizes nearer to the Market". ...or something like that...
This stuff really works, but "the Devil is in the excruciating Details", as always.
Not sure what MBO means, but I think it means identifying the individual Market Makers which form the composite Size at each Market Depth Price level.
In my experience, YOU DO NOT NEED that level of DOM feed Analysis, in order to get Predictive information from the Depth of Market. At least, I've never had it; and haven't found it necessary.
I'm not denying that "more information could be better" but my guess is that such information would not improve prediction more than roughly 10% so it's a lot of work to do; with a low probability of significant utility.
Heck, with just a simple 10 wide DOM there's a huge amount of predictability; no need to get a super expensive feed, and try to extract even more information. I really doubt it would be fruitful... even if you could figure out how to interpret it.
[EDIT] I am using the Rithmic DOM which allows for 40 wide tiers on each side of the Market. But that's because I am also interested in "distant radar" which potentially exists in that data, having already mined just about all I can from the "near DOM" tiers. But I'm not going to be delving into the MBO information, even if it were available.
The big advantage I'm primarily concerned with is the ability to determine if a market order that has hit the market was generated from a stop or not. That can be factored into the calculations to determine when losses are being taken, and could give a more accurate reading of market maker positioning. I'm also trying to study the orders in the queues themselves to see if I can get indications from them of when a trend is attracting new participants to the market.
If I told you, I might be asked to kill you... Just kidding.
So, the basics apply here. MM-Buy transactions are (by my definition) Trades which take place at the BID;
and MM-Sell transactions at the ASK/OFFER Price.
Any time MM can Buy from a Retail Seller at the BID price, and then Sell that same quantity higher up
in price (even if it's only 1 minimum Tick) then that is MM profit, and that Size is eliminated from the "open inventory".
So, to answer your question, when being evaluated for LONG Inventory,
if MM Buys 10 and then ANY MM Sell at A HIGHER PRICE, like your 2 Trades of 5 each occurs,
then that Inventory is neutralized, profit is taken and it is no longer MM Open Inventory.
Let's say MM buys 10, and there's a higher price trade with size 15; then the 10 contracts are
eliminated (neutralized) and that higher Priced Trade (for purposes of the analysis scan)
is set to 5 remaining, since 10 was used to match the MM-Buy.
For a LONG Inventory scan; using the term "Long" loosely, but meaning MM has more BUY
transactions in Inventory than Sell transactions, remembering that we SORT/ORDER the Buy
list and the Sell lists. So these lists would be sorted in ASCENDING order; and then you might
think we could start with the LOWEST BUY Transaction, and then "borrow volume" from any
just higher SELL transactions (eliminating that BUY from Inventory, as closed profit)
proceeding up the BUY Orders, and eliminating them, when their Size can be "borrowed"
from higher Priced Sell Orders.
You might think that would be the way to do the Matching. HOWEVER, I prefer to start with
the HIGHEST BUY transaction and proceed downwards in Price, finding any higher priced SELL
transaction whose volume can be "borrowed or matched" with the BUY transaction, in order
to eliminate it from inventory. BUT WHY?
In this way, I will attempt to eliminate HIGHEST priced BUY orders (remember, we are evaluating
here for a "LONG" MM Net Position) and then LOWER priced BUY orders may remain
unmatched. THIS ALLOWS ME TO UNDER-ESTIMATE MM'S COST BASIS.
I WANT TO UNDER-ESTIMATE MM'S COST BASIS because if Market Price is below that
under-estimation; it is MORE LIKELY that MM is "in risk" or "losing money" on the
Net Open Inventory estimate. So I am more confident when I say "MM is in Long Risk"
and is less likely to want to lower the price further. If I had a higher estimate of
MM's Cost Basis, then I'd be less confident that MM was "in Risk" than if I use an
algorithm which under-estimates (estimates a lower price) for MM's Cost Basis. Savvy?
You can get MBO data with Bookmap. I looked at it, didn't spend a lot of time on it so not sure what the true value is. Might be interesting to start a thread where traders who are using MBO can contribute.