Welcome to NexusFi: the best trading community on the planet, with over 150,000 members Sign Up Now for Free
Genuine reviews from real traders, not fake reviews from stealth vendors
Quality education from leading professional traders
We are a friendly, helpful, and positive community
We do not tolerate rude behavior, trolling, or vendors advertising in posts
We are here to help, just let us know what you need
You'll need to register in order to view the content of the threads and start contributing to our community. It's free for basic access, or support us by becoming an Elite Member -- see if you qualify for a discount below.
-- Big Mike, Site Administrator
(If you already have an account, login at the top of the page)
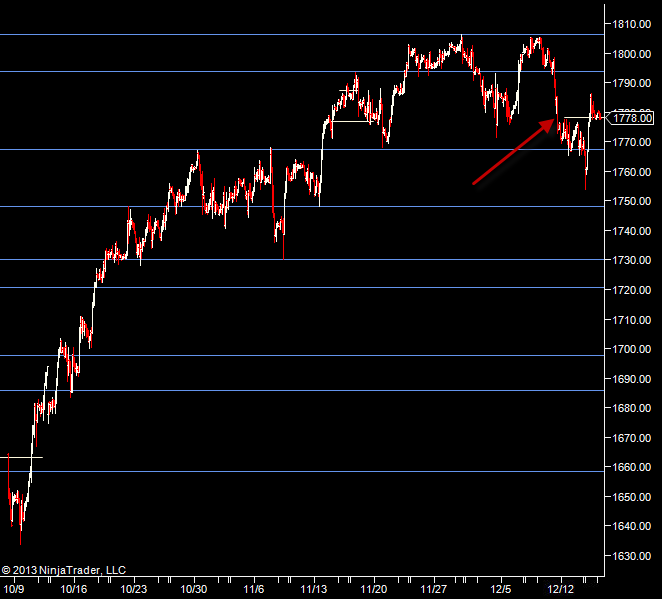
The upshot is that someone threw 10k contracts at the S&P overnight all in one go. So we have to treat the move down in the Globex with suspicion.
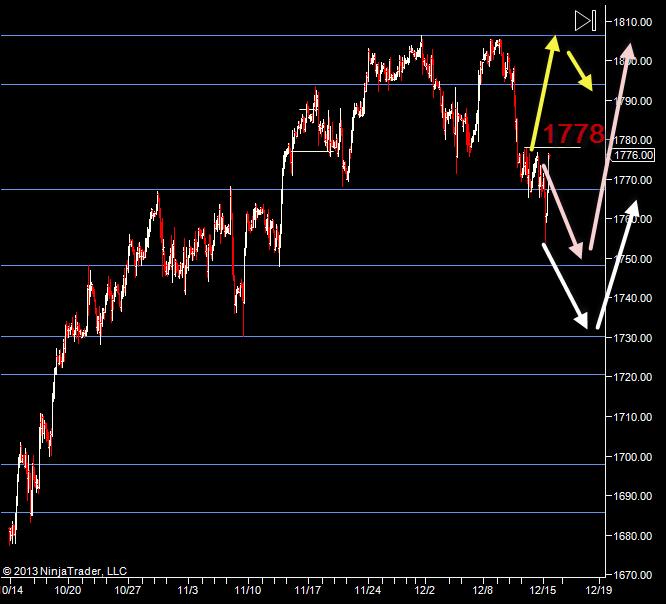
So we were holding our 1767.50 level until we had that fat fingered trade. Now we are above it again. So the premise for a move down to 1767.50 and then a move up to 1806.25/1812.50 is still on the cards. So my first scenario for today is a move up. For that it appears that the 1778 level is a major line in the sand.
The other scenario is a move down to 1749.25 area before bouncing up. The overnight action is suggestive of that but because of what caused it, that's lower probability. If 1778 gets tested and holds, then it becomes higher probability and if 67.50 breaks it becomes higher still.
Last week had 2 distinct and separate distributions and above 1778, we had very volume all the way up to 1792. So if we do pop 1778/1779.25 to the upside we could go up quite quickly.
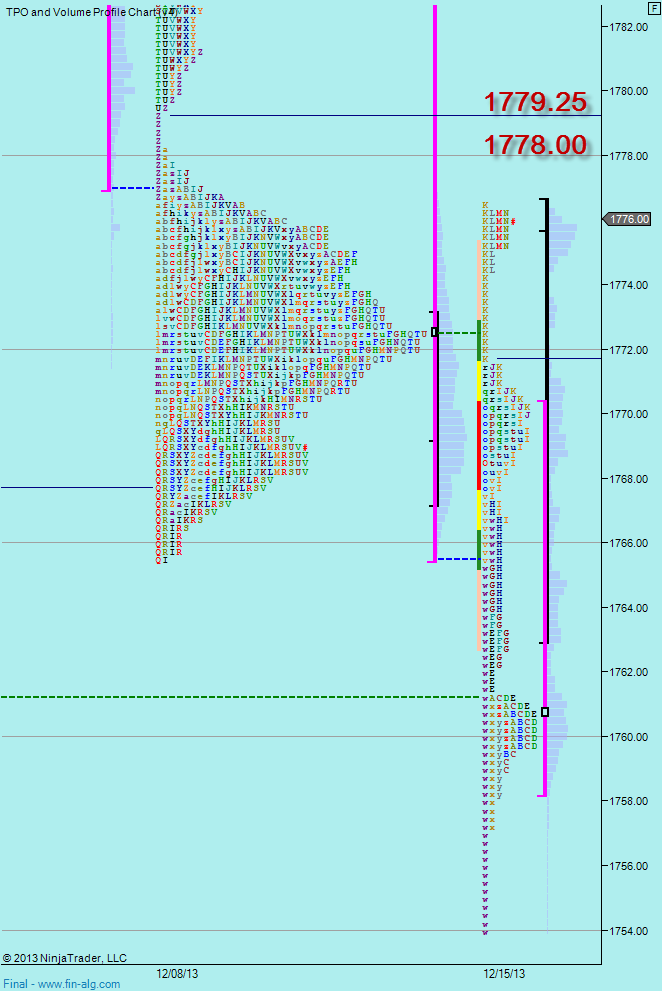
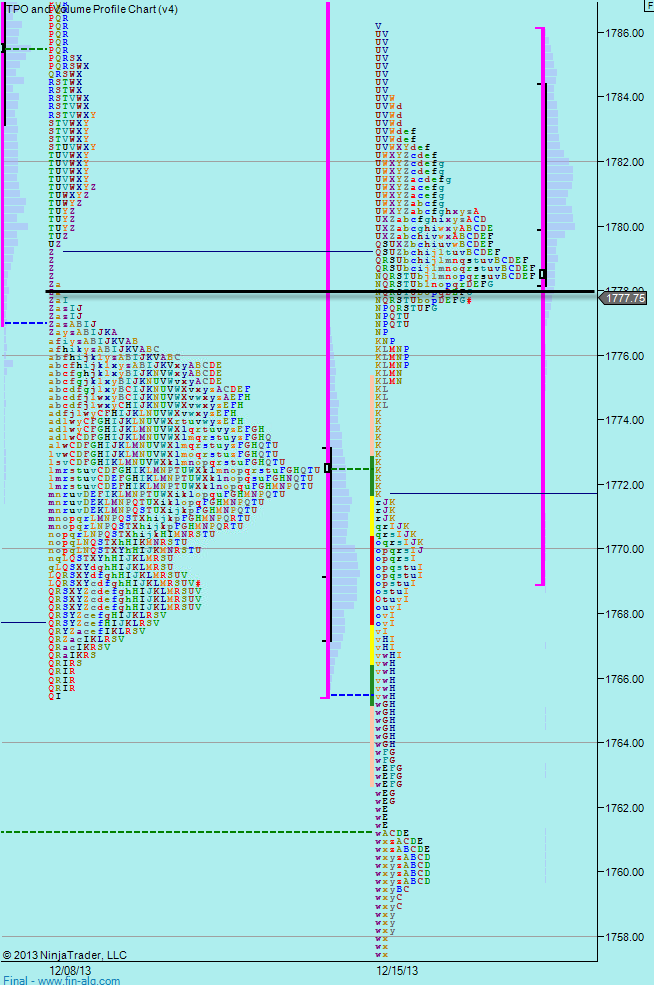
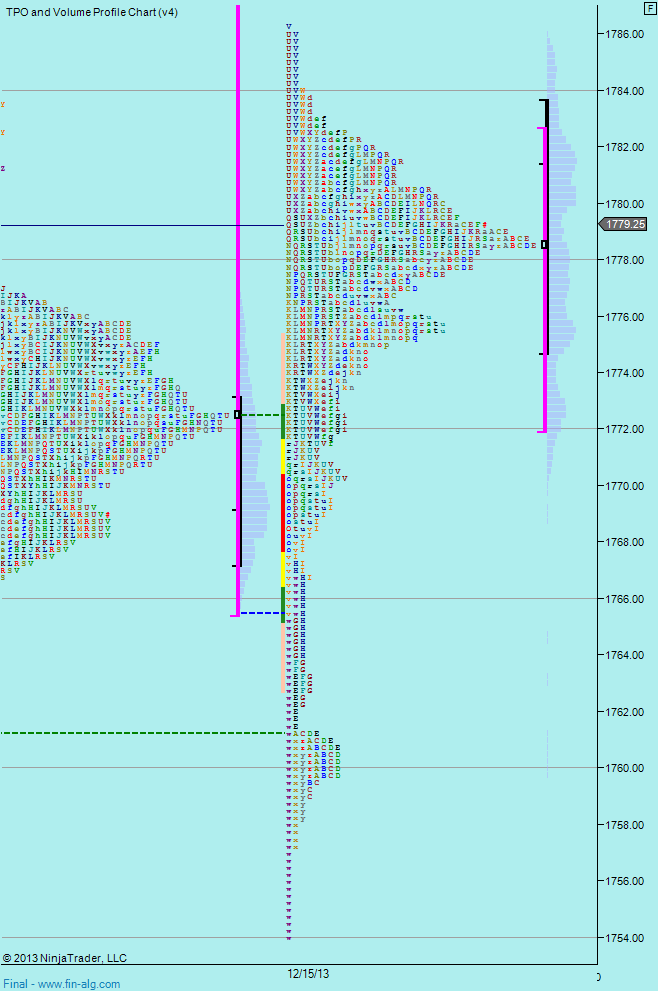
The weekly profile suggests out line in the sand for upside might be at 1779.25 - and that's close enough to 1778 for me to be extra confirmation that it's significant.
Fridays action was within Thursdays range but value was slightly lower. There was still a lot of rolling on Friday. We can see again the significance of the 1778-1779.25 area.
Weekly Numbers
Range - 1765.50 -> 1805.25
Value - 1765.50 -> 1797.50
S1 - 1754.25, R1 - 1794
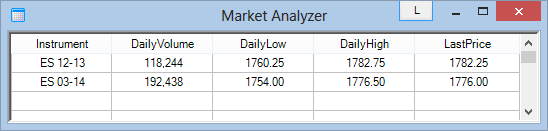
Daily Numbers
Range - 1765.50 -> 1774.75
Value - 1767.50 -> 1772.00
Globex - 1754.00 -> 1778.50
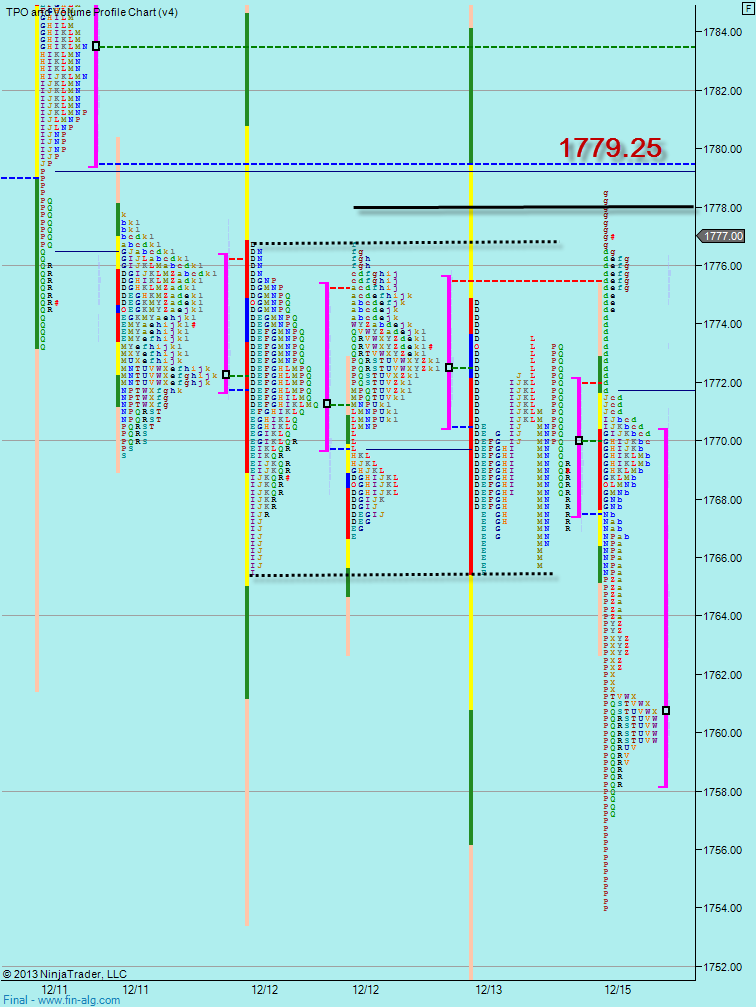
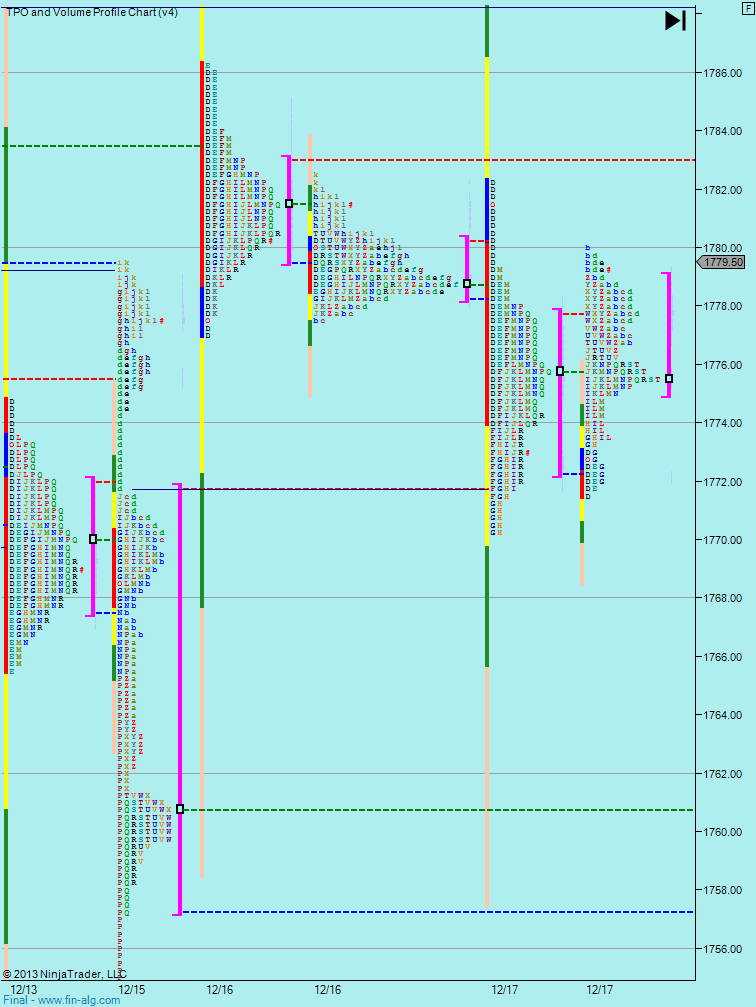
Yesterday we were looking for the 1778 area to give us some indication of whether we'd now move to the highs or go back down to the mid 1700's.
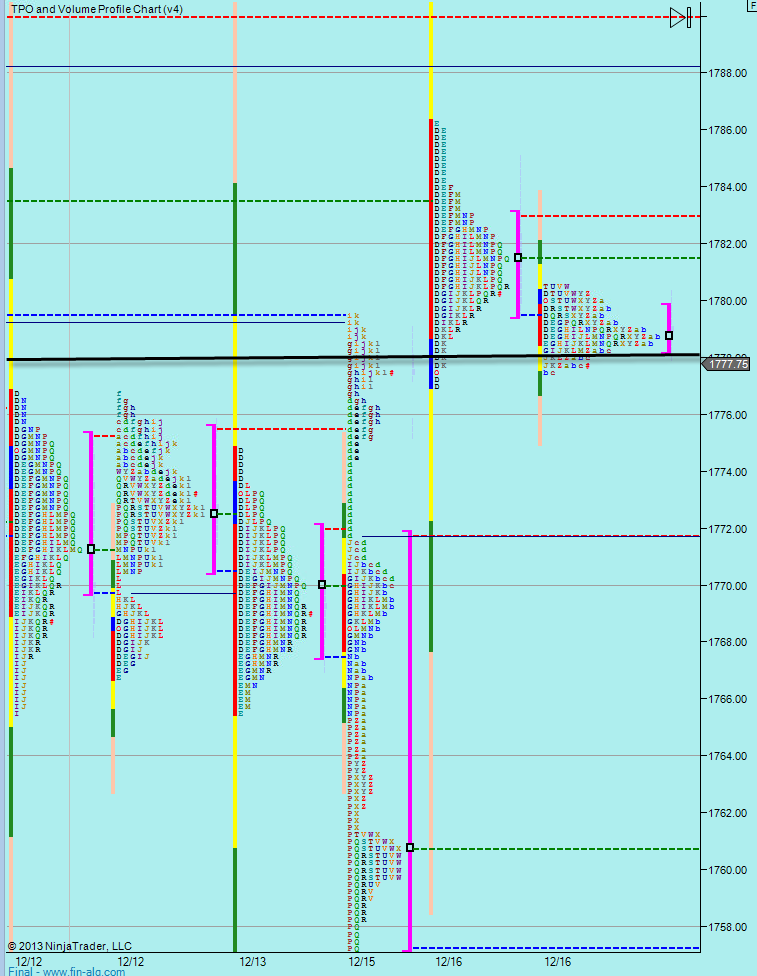
As you can see we popped up through that level yesterday and have since been resting on it.
We can see that we have traded below the 1778 level but not too much so far.
And here is yesterday and todays Globex so far.
So basically, same situation as yesterday but so far 1778 is holding but we aren't really pushing up yet. As such, I think the game today is all about that level holding or breaking.
Nothing more to add to what was said yesterday.
Weekly Numbers Range - 1765.50 -> 1805.25
Value - 1765.50 -> 1797.50
S1 - 1754.25, R1 - 1794
Daily Numbers
Range - 1754 (globex), 1777 -> 1786.25
Value - 1779.50 -> 1783
Globex - 1777.50 -> 1780.50
We are slowing down now into the end of the year. It's very thin on the ES and liable to slip around 3-4 ticks without any notice. That does change the game somewhat.
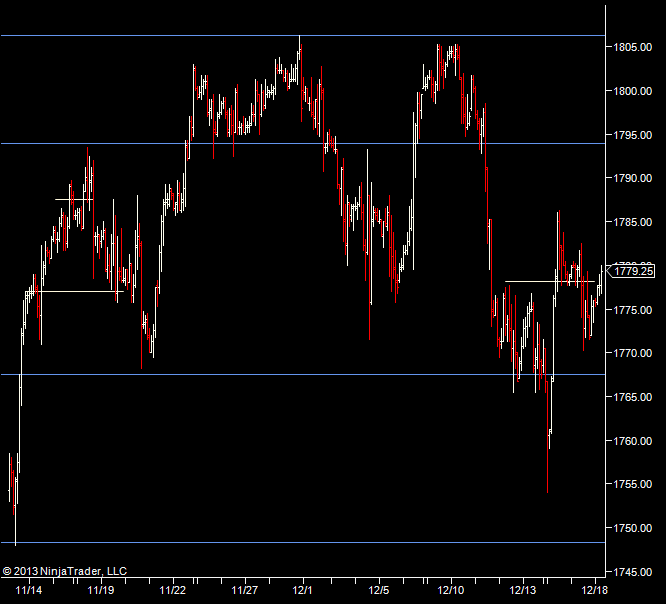
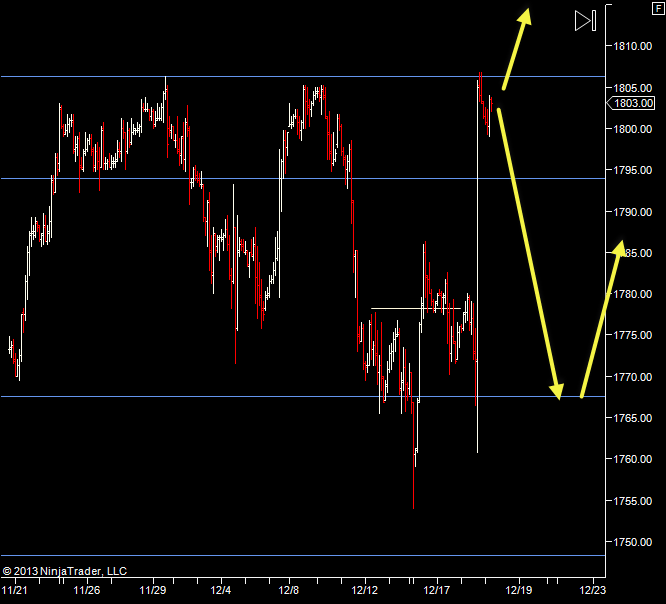
We have been rotating around the 1778 level (small white line on left side). So we have a range in the middle of a larger range and still waiting to decide if it's back to the highs or down to 1767.50 and possibly 1750.
So far, the Globex session is within yesterdays range.
So to me - it's all fairly neutral. I'm expecting a rotational, morning both because of the above and because FOMC day. I would expect some moves on the FOMC statement later. If not, I expect the rest of the week to be in a small range.
Weekly Numbers
Range - 1754.0 -> 1786.25
Value - 1772 -> 1782.50
S1 - 1754.25, R1 - 1794
Daily Numbers
Range - 1770.25 -> 1782.25
Value - 1772.25 -> 1777.75
Globex - 1777.50 -> 1780.50
At the start of this week, the question was? "Are we going back to the highs to complete the range or breaking down towards 1767 & 1750.
So the question got answered but it made the trip in one day, so it's not as if the answer helps because the next question is "now we are at the highs, will we turn down to complete the range to the downside or make new highs?" Target for the downside would be the weeks VAH 1784.
With the big move up yesterday. I'm not going to be paying much attention to either of the profile charts. I'll be looking for signs of selling off the open and if not, weakness as we get back to 1806.75.
Weekly Numbers
Range - 1754.0 -> 1806.75
Value - 1766 -> 1784.00
S1 - 1754.25, R1 - 1794
Daily Numbers
Range - 1760.25 -> 1806.75
Value - 1766.25 -> 1792.75
Globex - 1799.00 -> 1806.75
First trading day for me after the New Year. I like to trade days with lots of liquidity and I'll be looking for the return of decent volume to the market over the next few days.
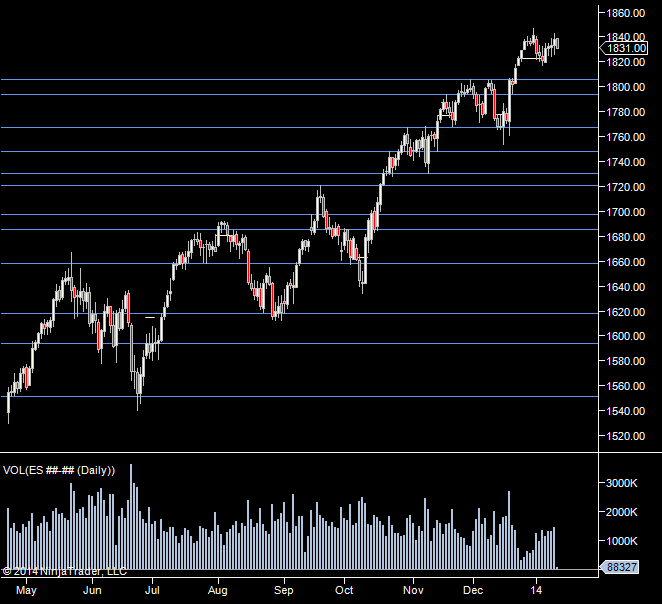
Seems like whilst the cat was away, the mouses were playing. My first thoughts looking at this is wondering whether this move up over the holiday period will hold when the volume comes back or if we will revert back into the range ww were in from Mid-Nov to the holidays.
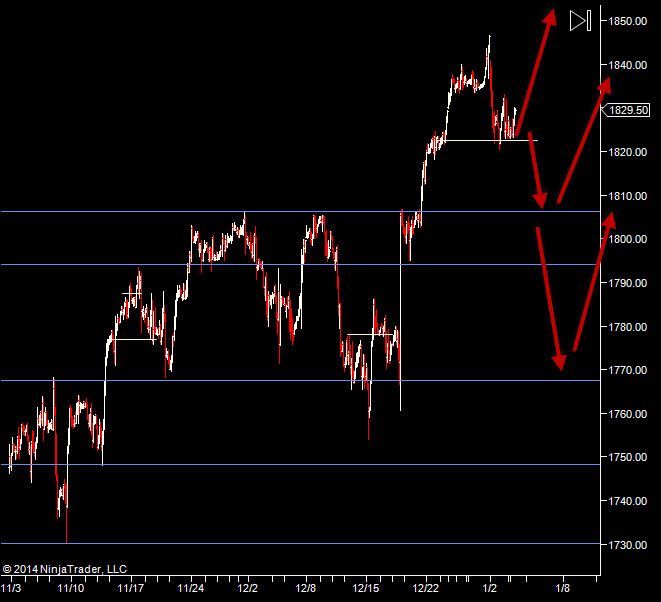
I'm looking to confirm one of these three 'bigger picture' scenarios.
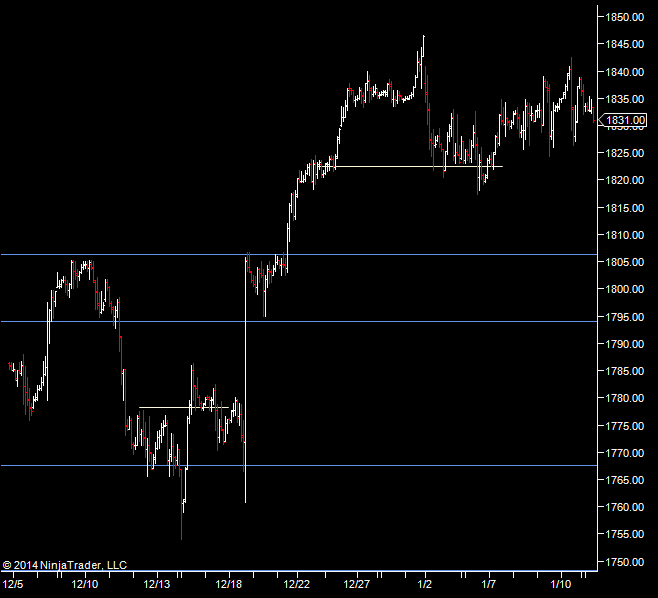
- Move straight up from here - which means holding the 1820.50-1822.50. A test of that area and a push up will have me thinking we are at least headed to 1850
- We break down and go back to 1806.25 area and turn back up - giving us the potential of an 1806-1850 range over the next few weeks
- We break down further into the pre-holiday range and head to 1767.50 area to test that range low.
So my major lines in the sand are 1822.50, 1806.25 and 1767.50. These are not levels I expect to hit today - just laying out how I see it playing out over the next few days so I have a bit more confidence in what's happening at a lower level.
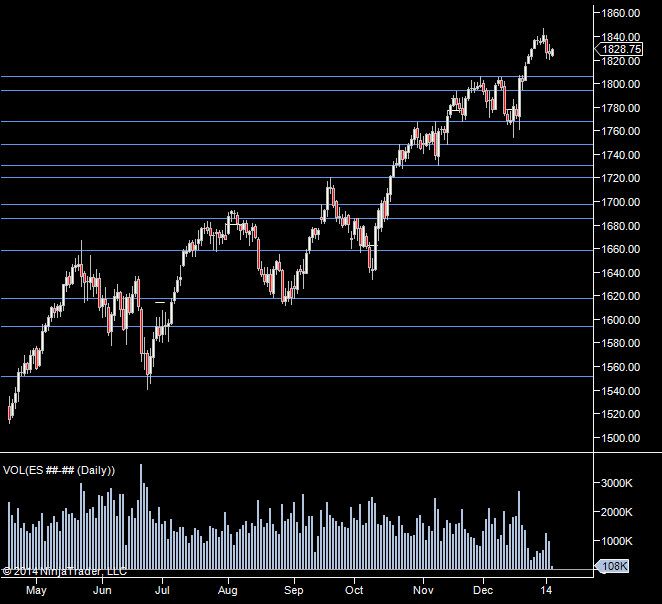
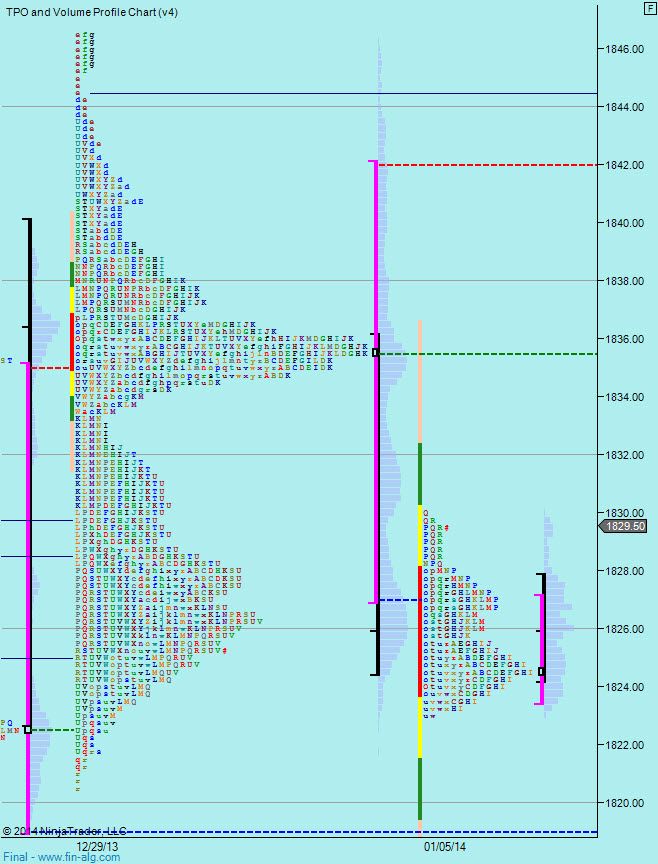
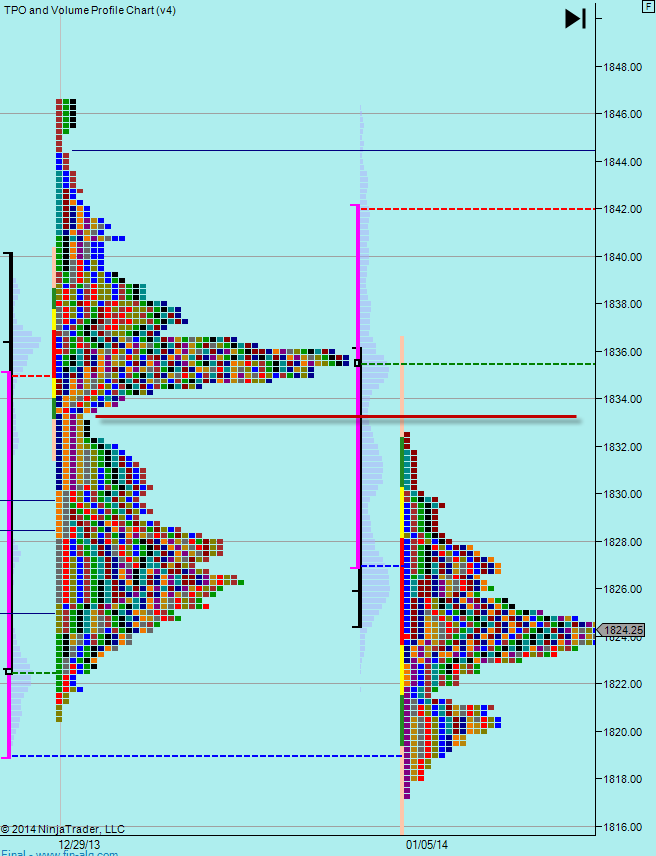
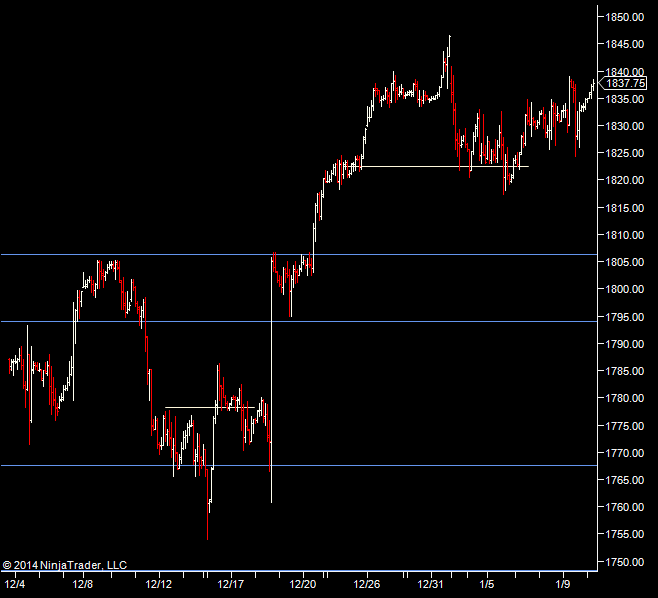
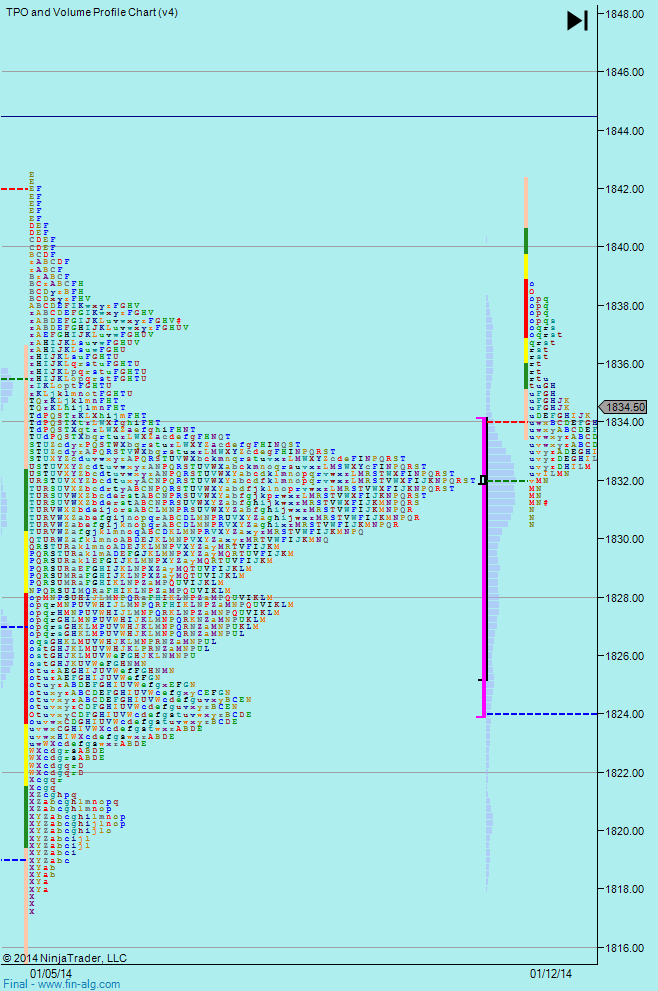
The weekly picture shows a 26 point range last week. We do have 2 distinct distributions, so I will be watching 1833.25 for rejection but last weeks was fairly light on volume and so I don't take the levels as seriously. With the Globex session being within that but mostly below last weeks value. That looks fairly neutral to me but if we test and hold last weeks low, I'll be looking to go long.
We have a 7 point Globex range with Fridays close being about the middle of that range. Again it looks pretty neutral from that perspective, so I'll be looking for tests of Fridays range/value area for clues.
First day back after a break, I always feel a bit rusty and we have ISM Non-Man PMI at 10:00 am, so I'm going to watch it play out till after the release.
Weekly Numbers
Range - 1820.50 -> 1846.50
Value - 1827.00 -> 1842.00
S1 - 1816.00, R1 - 1840.75
Daily Numbers
Range - 1820.50 (globex)/1823 -> 1833
Value - 1824.25 -> 1830.25
Globex - 1823 -> 1830
My opinion is pretty much unchanged since yesterday:
"I'm looking to confirm one of these three 'bigger picture' scenarios.
- Move straight up from here - which means holding the 1820.50-1822.50. A test of that area and a push up will have me thinking we are at least headed to 1850
- We break down and go back to 1806.25 area and turn back up - giving us the potential of an 1806-1850 range over the next few weeks
- We break down further into the pre-holiday range and head to 1767.50 area to test that range low.
So my major lines in the sand are 1822.50, 1806.25 and 1767.50. These are not levels I expect to hit today - just laying out how I see it playing out over the next few days so I have a bit more confidence in what's happening at a lower level."
"The weekly picture shows a 26 point range last week. We do have 2 distinct distributions, so I will be watching 1833.25 for rejection but last weeks was fairly light on volume and so I don't take the levels as seriously."
You can see from the image above that we didn't move decisively either way.
Off the open yesterday we did move up towwards the 1833.25 level. We stopped short at 1832.50, failing to get to that upper distribution was quite bullish. We went almost 3 points below last weeks low before we started a choppy climb back up to Fridays close and then a drop back down to 1820.75
The Globex session sees us at 1823.25 as at the time of writing. In yesterdays range and in yesterdays value area.
Whilst we did have a good move down off the open yesterday, we really didn't make much headway down past last weeks low. So I can't really say "yes - it's scenario A, B or C" that appears to be playing out right now. I am biased to the downside the ideal scenario would be a pop up off the open and sellers responding. That could give us the 1806 today.
The only hurdle I see below is yesterdays low. I was expecting a break of last weeks low to give us more than a 3 point push down yesterday. So it may be that we break yesterays low and there's not much of a reaction.
Volume is still a bit light with 1.37M traded yesterday, but certainly much higher than last weeks volume.
Weekly Numbers
Range - 1820.50 -> 1846.50
Value - 1827.00 -> 1842.00
S1 - 1816.00, R1 - 1840.75
Daily Numbers
Range - 1817.25 -> 1832.50
Value - 1820.00 -> 1827.50
Globex - 1819.25 -> 1825.50
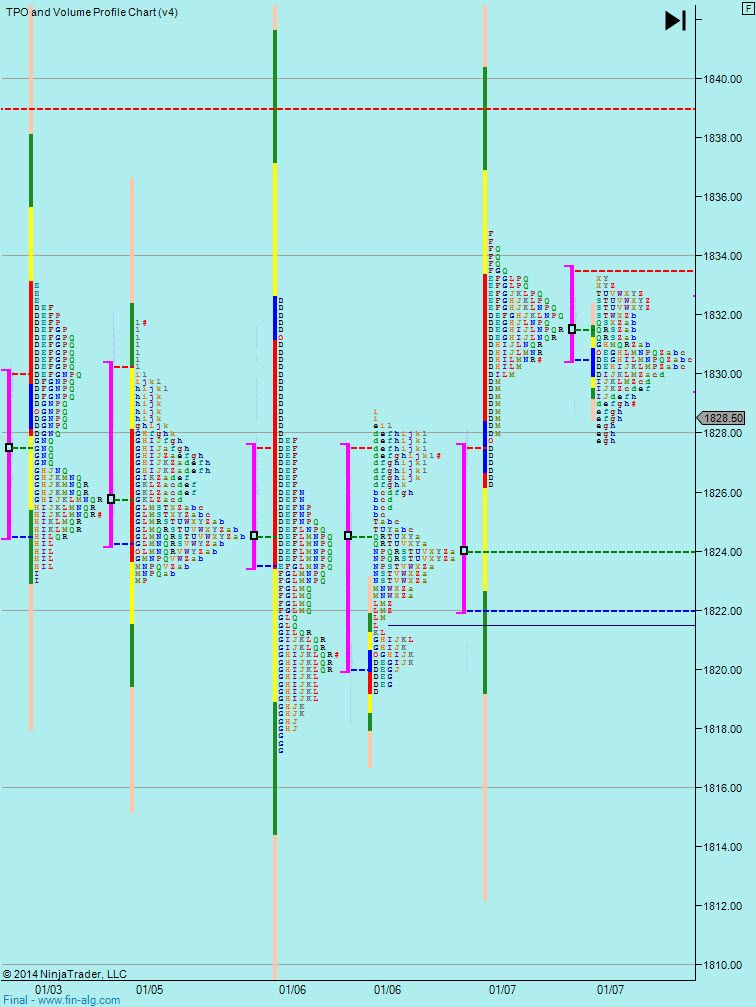
I'm still have the same question on my mind that I've had since Monday - can we hold these holiday highs, push up or revert mid Nov to mid Dec range.
We've poked below last weeks range and we didn't get much reaction. We poked through the 33.25 range and so far no reaction there. So from the longer term chart, it's indecisive and doesn't help me much.
The weekly profile is a little more helpful. As you can see last week we have 2 distinct distribution areas. Looking at the weekly profile, we can see that the upper distribution is still holding.
Volume is still light Monday was almost 1.4 Million but Tuesday a little under 1.2 million. Range yesterday was a bit narrow at 8 points so we really didn't make much of the push up.
What we do have is yesterdays pit session low at 26.25 and the globex low at 27.75. That's a line in the sand for me today. If that area holds, then I see us moving up into that upper distribution from last week towards 46.50 again. If not, I see us going back to the weekly lows then 1806.25. If that breaks 1796.50 and into the Nov-Dec range.
Weekly Numbers
Range - 1817.25 -> 1834.75
Value - 1823.00 -> 1831.50
S1 - 1816.00, R1 - 1840.75
Daily Numbers
Range - 1819.25 (globex)/1826.25 -> 1834.75
Value - 1830.50 -> 1833.50
Globex - 1827.75 -> 1833.25
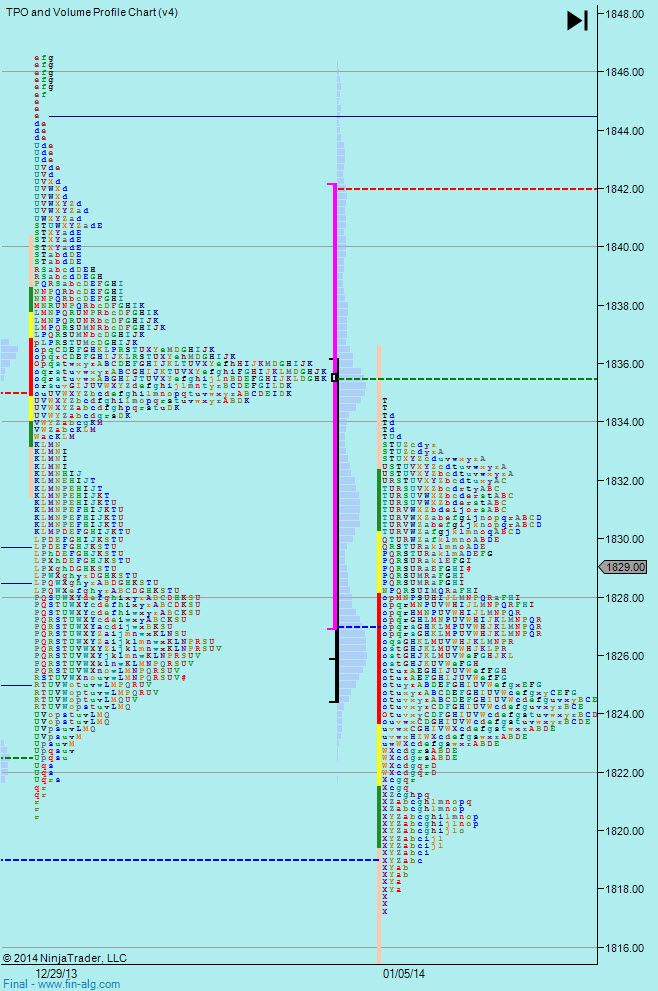
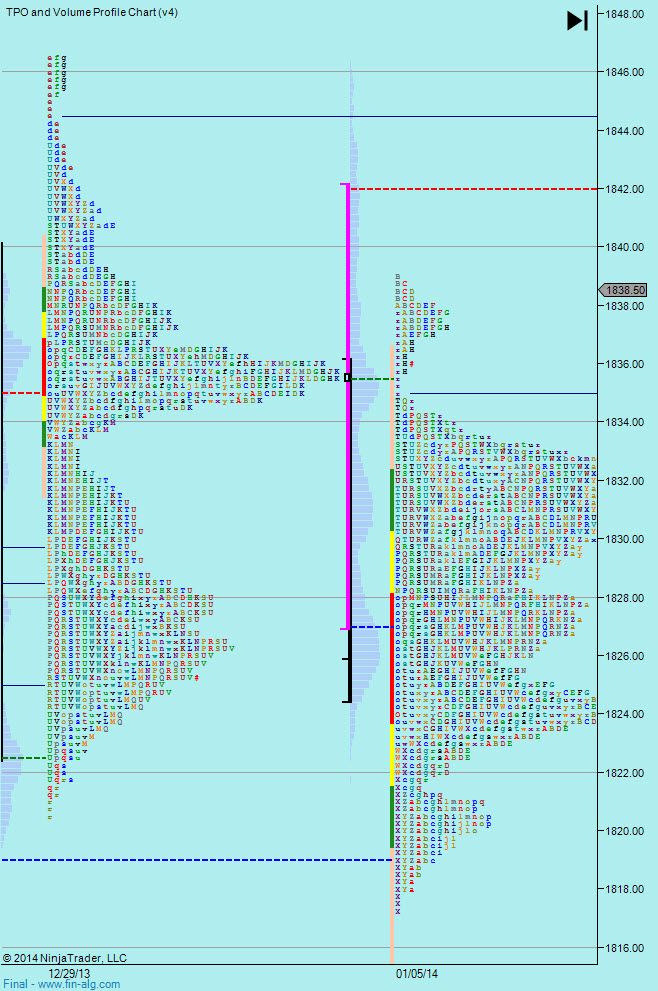
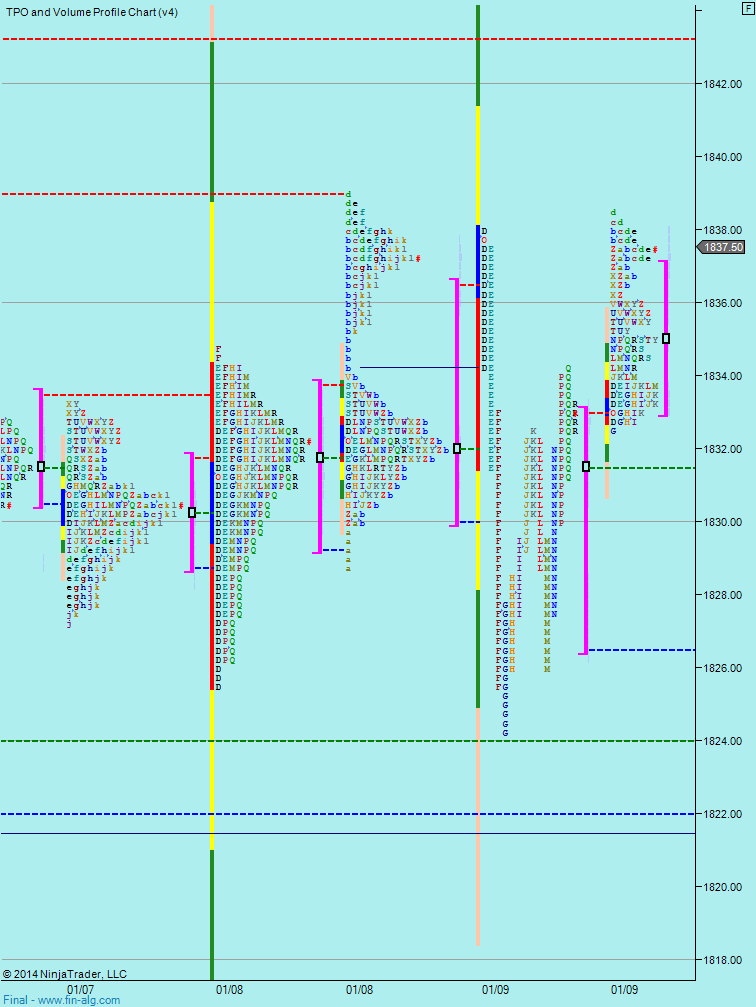
On the face of it, the market has tipped it's hand and shown us it wants to go for the 46.50 high again.
The weekly profile shows a single print at 1835 - which is an area the market only traded 30 mins or less.
The thing is though - yesterdays pit session was neutral - we traded almost entirely within the prior days range. Just 3 ticks below the prior pit low with the same high.
So this move up into the upper distribution from last week is all in the Globex session. As the Globex session has had a push up overnight, I'm watching out for sellers stepping in off the open. Then looking to see if yesterdays low holds.Basically looking to see if this push up really resolves the range we have been in all week and is a sign we will push the highs again OR if this overnight push up gets taken back and we now head to 1806.50.
Weekly Numbers
Range - 1817.25 -> 1839.00
Value - 1824.50 -> 1833.50
S1 - 1816.00, R1 - 1840.75
Daily Numbers
Range - 1825.50 -> 1834.75
Value - 1829.25 -> 1833.75
Globex - 1828.75 -> 1839
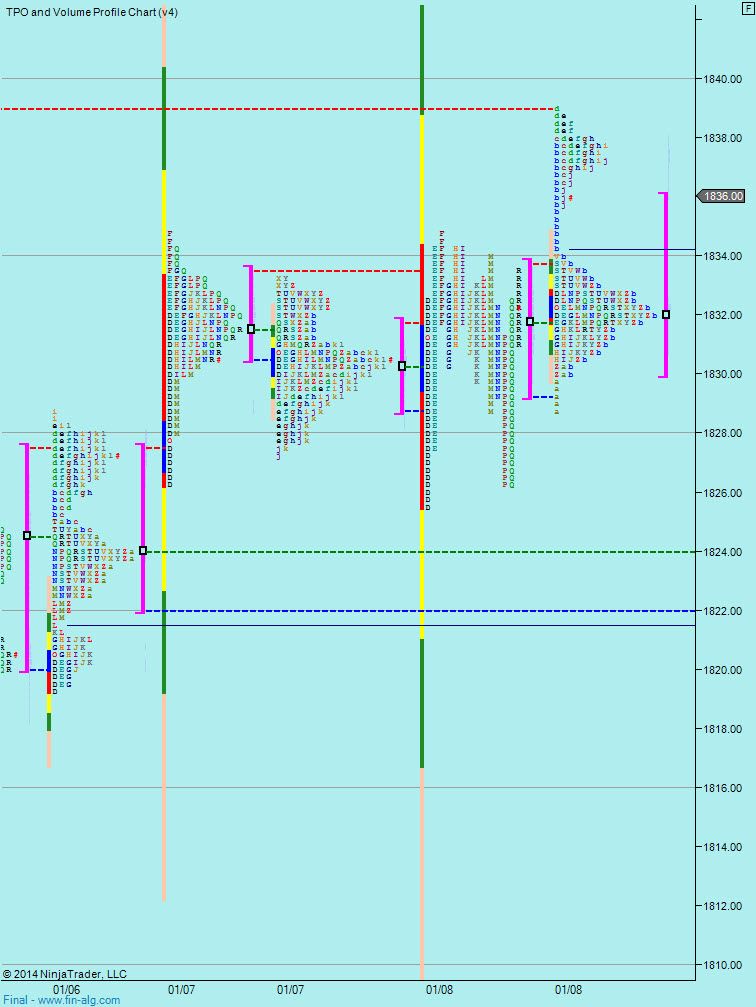
Looking at the bigger picture it is looking more likely that we are going to hit 46.50 than revert to the range below 1806.50 we were in late last year.
Yesterday we had a push up on light volume in the Globex session. One of the things we were looking at were sellers stepping in right of the open. That's what we got BUT we didn't push much below Wednesdays low before recovering.
Once again we have Globex pushing up from yesterdays close. This time though, it's staying within Thursdays range so far. So we could get another correction down off the open but it's a bit less likely as being in the prior days range makes is somewhat more neutral.
So look for the sell of, but be wary around yesterdays close/value high as we may well use that as a launch point up to the highs.
No trading for me though - I just got bitten by a dog our cycling - so off for Rabies shots instead! Marvellous....
Weekly Numbers
Range - 1817.25 -> 1839.50
Value - 1824.00 -> 1833.50
S1 - 1816.00, R1 - 1840.75
Daily Numbers
Range - 1824.25 -> 1838 (pit)/1839 (globex)
Value - 1826.50 -> 1833
Globex - 1832.50 -> 1839.50
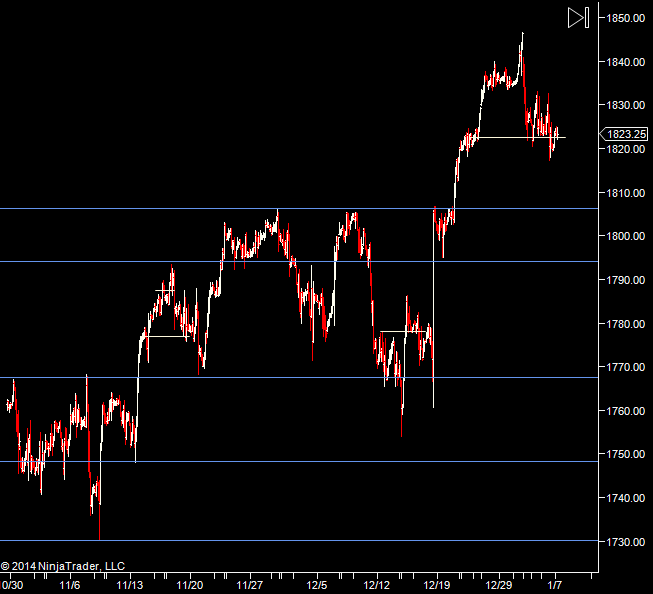
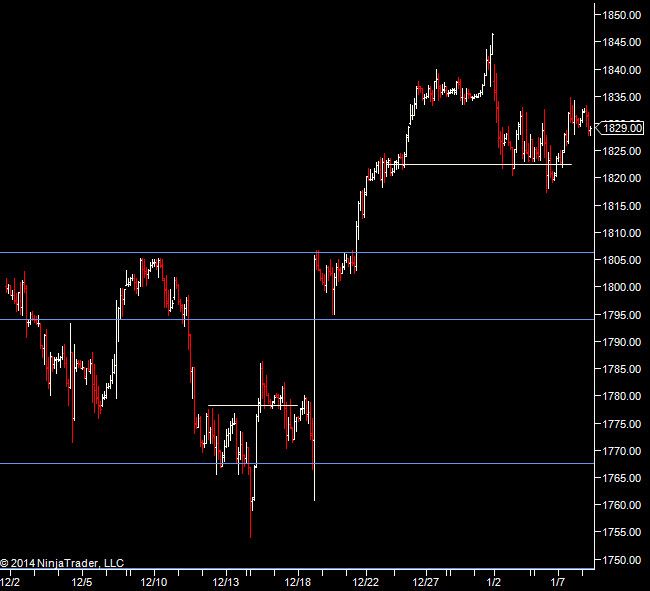
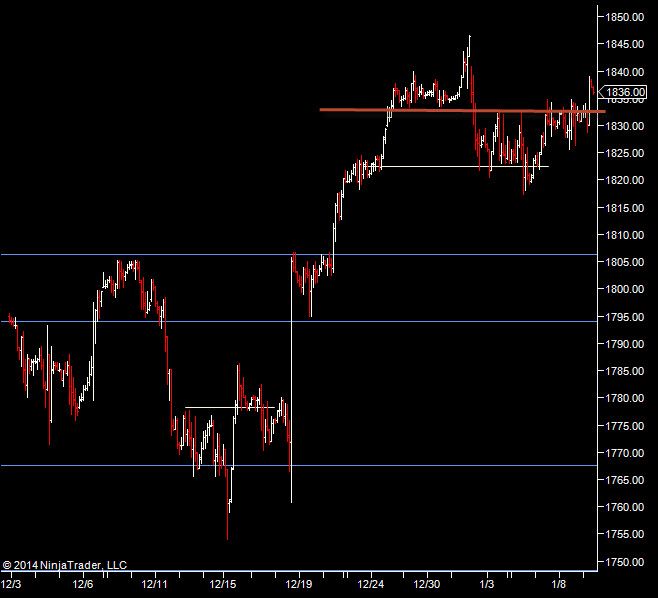
Last week we got some but not all of the pre-holiday volume back. We are close to the "Santa highs" and we haven't really resolved the question of whether they will hold or if we will drop back into the Mid Nov-Mid Dec range. Hopefully we'll get more volume in to the markets this week.
Looking back at last week it was sideways with a somewhat positive slant. So you have to say that a break of the high this week looks more likely than back thru 1806.25 down to 1794.14 and then to 1767.50.
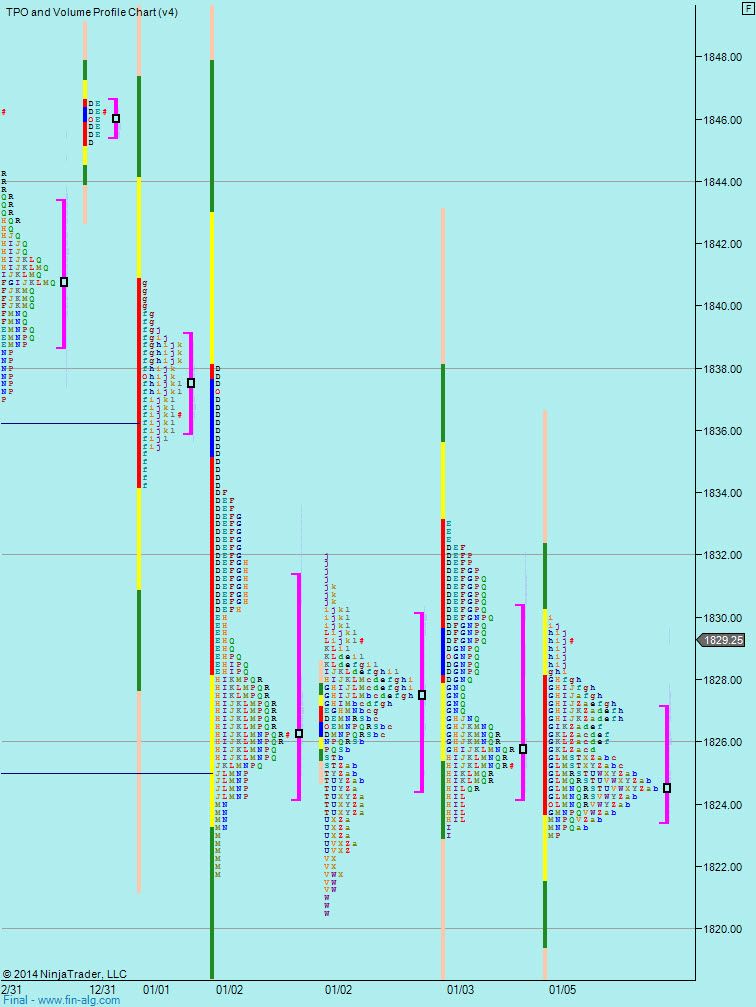
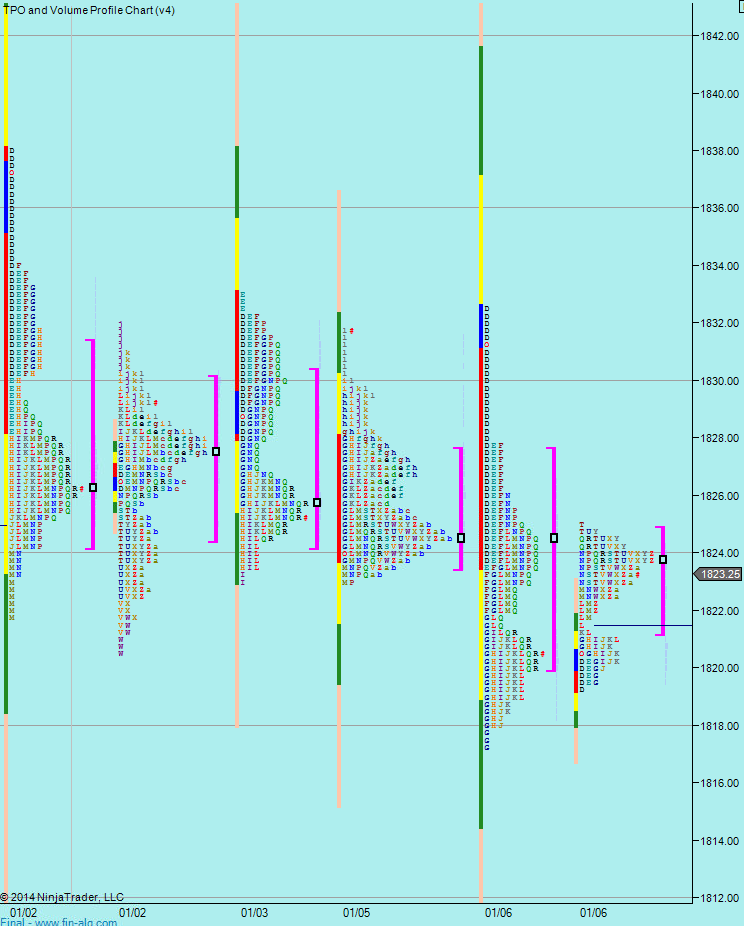
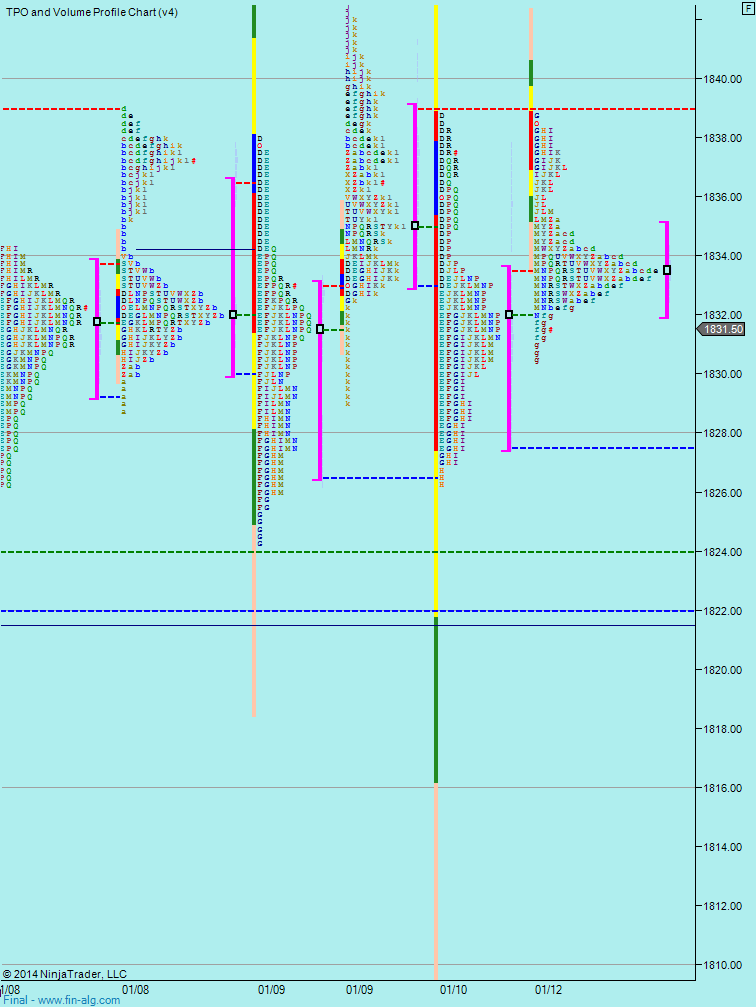
Looking at the weekly profile, we can see the bulk of trading last week was around the 1832 area and not much above it. If we are to move down, it will probably be a grind as we chew through that area of high volume. On the other hand a move to the upside will most likely be faster. We are close to the middle of last weeks range, just above where the volume was. That in itself is never a good thing if you are looking for volatility.
Here's something else you don't really want to see if you want volatility - the globex session being in the range of the last 3 pit sessions...
So - I'm looking for a grind if we move down and acceleration if we get above 1838, if that happens, I do expect last weeks high to be tested (1842.50) and then a run to the Santa high 1846.50. A poke through that and we could then have a 1806-1850 range to rotate around for a few weeks.
Should we go down, then it;ll be slow till the low 20's after we can accelerate to last weeks low and test the 1806.25.
Weekly Numbers
Range - 1817.25 -> 1842.50
Value - 1824.00 -> 1834.00
S1 - 1826.75, R1 - 1845.33
Daily Numbers
Range - 1826.00 -> 1838.75 (pit)/1842.50
Value - 1827.50 -> 1833.50
Globex - 1830.50 -> 1838.75