Welcome to NexusFi: the best trading community on the planet, with over 150,000 members Sign Up Now for Free
Genuine reviews from real traders, not fake reviews from stealth vendors
Quality education from leading professional traders
We are a friendly, helpful, and positive community
We do not tolerate rude behavior, trolling, or vendors advertising in posts
We are here to help, just let us know what you need
You'll need to register in order to view the content of the threads and start contributing to our community. It's free for basic access, or support us by becoming an Elite Member -- see if you qualify for a discount below.
-- Big Mike, Site Administrator
(If you already have an account, login at the top of the page)
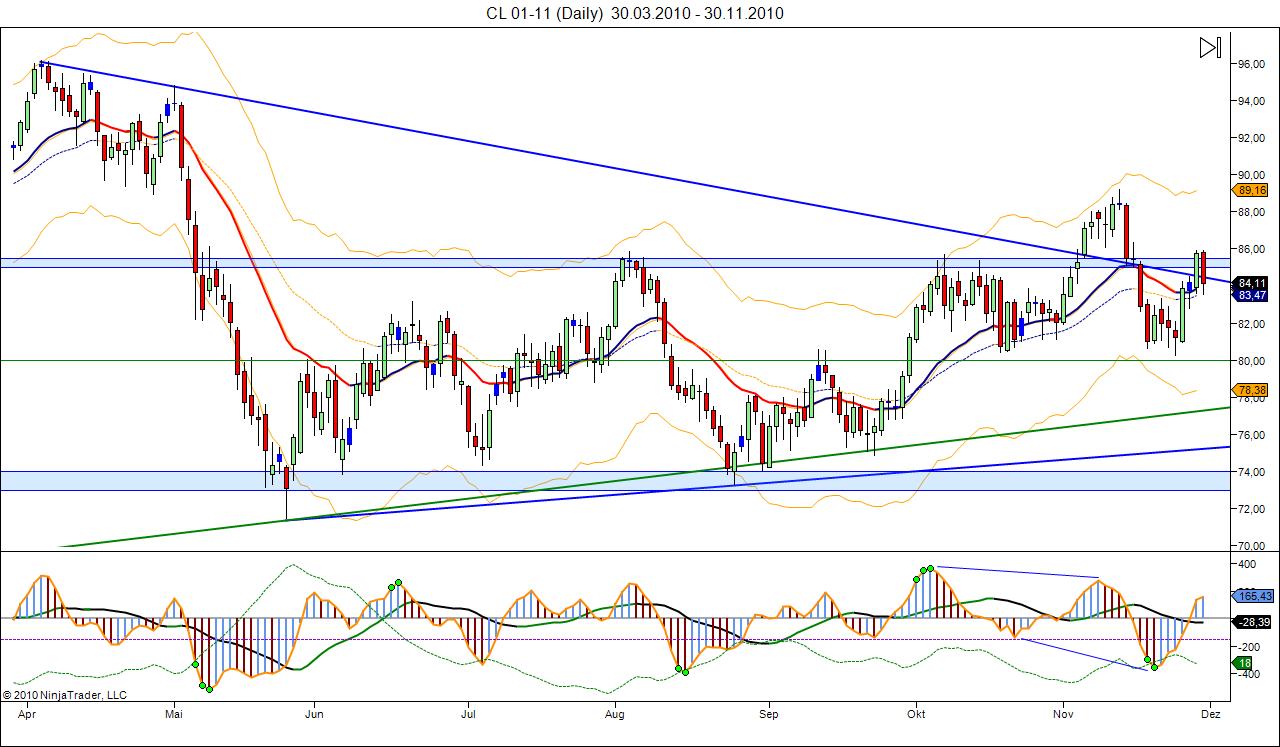
I agree and have had $90 oil on my prediction list for a bit now....Here is a chart of the daily picture with my interpretation of it. $90.48 is 125% extension of the recent retracement.
89.41 is 75% fib on the major short leg so the $90.00 oil price should result in some chop on the daily chop and a possible pull back as well....We may see the pull back before it gets there but I think it powers to $90 over the next few days.
84.35 is a 50% retracement on the last leg up....that means it either needs to hold there or we see 80.00 again before moving back higher.....I am voting for consolidation here in the 83.5-85.5 range then an attempt at 90.
We'll see....my prediction of powering to 90 fell short a bit.
Simplicity is the ultimate sophistication, Leonardo da Vinci
Most people chose unhappiness over uncertainty, Tim Ferris
Since my last post CL tested breakout area, then moved up to 88,63, couldn´t reach $90 perhaps because of divergence on a daily chart and now retest of daily trendline. We´ll see what will happen...
DX is also testing a resistance area.
Crude didn't top out because of the divergence on the chart. The divergence on the chart might have been one clue that CL was over bought and susceptible to price exhaustion, but not the cause of CL selling off. It was in part, event driven by changes in macro-economic conditions, i.e., China and the dollar, and in part driven by changes in micro-economic and technical conditions, i.e, everybody was stuck the same way. Charts are only a graphical representation of price action, that gives you a point of reference and reflects what is transpiring in the marketplace.
Yes, you´re right. Perhaps I have not made myself clear. What I meant to say was that divergence on a higher timeframe is a notable hint that a retracement might occur soon.
Hello Mike just looking at your charts, what times do you use stop and starting time. Do you pay attention to the overnight. And what is the reason behind it?
I start trading when I am calm, focused, prepared and the market is moving a manner that makes sense to me. I stop trading when I am anxious, distracted or if the market is moving in a manner that I do not understand.
I do have 24h globex charts open and use them for session high and low. My 5m chart is a RTH chart as I prefer to see the gaps and prefer to use cash session pivots.