Welcome to NexusFi: the best trading community on the planet, with over 150,000 members Sign Up Now for Free
Genuine reviews from real traders, not fake reviews from stealth vendors
Quality education from leading professional traders
We are a friendly, helpful, and positive community
We do not tolerate rude behavior, trolling, or vendors advertising in posts
We are here to help, just let us know what you need
You'll need to register in order to view the content of the threads and start contributing to our community. It's free for basic access, or support us by becoming an Elite Member -- see if you qualify for a discount below.
-- Big Mike, Site Administrator
(If you already have an account, login at the top of the page)
Sorry for late chart and no pre market chart. In my notes, I had 102.82-103.43 as resistance and 100 as support. As usual I let OR ( opening range ) along with Volume spikes let me guide.
Can you help answer these questions from other members on NexusFi?
One of my areas to improve for 2012 is not to trade counter trade unless some REAL VOLUME shows up taking out resistance. DXY with A up, 6e , ES, TF etc.. with A down along with negative market internals were there all day long to guide a trader.
My last trade of the day was at 12.20 pm short from 99.92 and cover as usual early at 99.62. It was a RISK OFF day.
When " All the stars line up" set up. There is a reason I call Mark Fisher a GENIUS. One can wait all day to short CL at ideal resistance level or let failed A up with market internals guide the way.
I think you mean 'position trading'. Holding a swing trade for a year would be one hell of a profitable trade or one hell of an unexpected loss! hahaha....
Is it me, or I just don't get your charts AT ALL. I don't see the ACD or any of it? Is it hidden or I guess I must read Mr. Fisher's book.. Any way to dumb down your charts some?
The charts do not show the breakout levels and pivots, on which the ACD method is based.
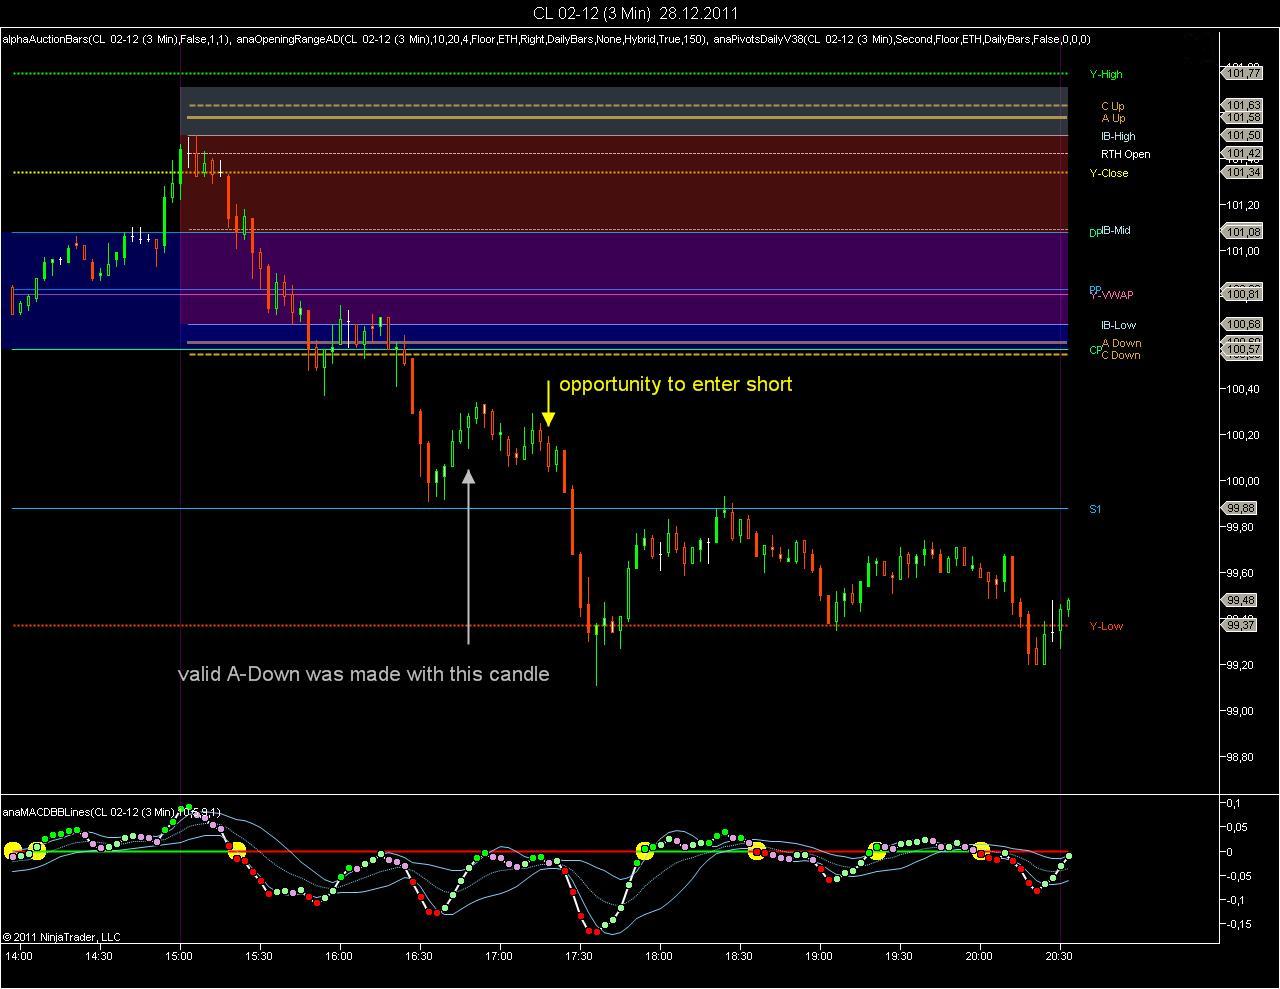
Below is yesterday's chart for CL 02-12. The main ETH pivot (and prior day's VWAP) are located at 100.82. The blue range is the pivot range, which can be considered as a trend filter. The gray range is the night session range (101.72 - 100.68), the red bit is the opening range for the first 45 minutes. Fisher uses 45 minutes for CL, but smaller opening periods for other instruments.
The A-Down level is obtained by subtracting 8 ticks from the lower end of the opening range, the C-Down level by subtracting 13 ticks from the lower end of the opening range. For a valid A-Down, CL should remain at least 23 minutes (half the opening period) below the A-Down level.
A valid A-Down was made at 10:48 AM EST. There was a short signal at 11:18 AM, as indicated by the MACDBBLines (zero line rejection, second entry). As possible targets you could have taken the floor pivot S1 or the prior day's low, which had to be tested.
I use 45 minutes OR. majority of trader use 5 minutes etc.. 2 cyan lines represent OR. Bullish above cyan line, bearish below, is the first step. Then there are failed A up/ A downs etc.. and a host of other set ups combined with pivot ranges, 30 day number line etc..
I have invested 4,000 hours ( LIVE and SIM) in ACD method. ACD is a logical and easy method but requires time. I will recommend reading MF book. On my charts all bars are blackened out except the one which show an EFFORT on part of traders to break a level. I am not trading chart patterns. ACD is a price based method.
I give OR levels as lines are tough to see on my charts. OR levels are fixed every day for me by 9.15 am eastern time.


 Holding a swing trade for a year would be one hell of a profitable trade or one hell of an unexpected loss! hahaha....