Welcome to NexusFi: the best trading community on the planet, with over 150,000 members Sign Up Now for Free
Genuine reviews from real traders, not fake reviews from stealth vendors
Quality education from leading professional traders
We are a friendly, helpful, and positive community
We do not tolerate rude behavior, trolling, or vendors advertising in posts
We are here to help, just let us know what you need
You'll need to register in order to view the content of the threads and start contributing to our community. It's free for basic access, or support us by becoming an Elite Member -- see if you qualify for a discount below.
-- Big Mike, Site Administrator
(If you already have an account, login at the top of the page)
Thanks for these incredible indicators. They have made a huge impact on my trading. I was wondering if it is possible to write a version of these indicators (Visual SMA/EMA) that have a color selection capability for the slope of the indicator (e.g., slope up = green/slope down = red, slope flat = yellow, etc.)?
Here comes the next version of new VisualSMA and VisualEMA. I have now tested it for hours and days on range, tick, volume and minute charts. The indicator was fast and reliable. I have not found any serious bugs. There was a smaller bug in the interpolation algorithm for the last period (@madLyfe: thank you for the hint!), and there were some smaller deviations at the intersection between historical and real-time data. This is the weak link of NinjaTrader bar processing, the composite bars built from historical and real-time ticks are quite strange and do not follow a simple logic. Fortunately there is only one transition bar on each chart. The indicator usually catches those transition bars in correctly. In rare cases - less than 1% - the composite bar of the secondary bar series is left out, and the last historical bar is directly connected to the first real-time bar.
The new indicators are attached. I am confident that I can upload the next version to the download section for general use.
Hi Fat Tails,
I'm trying to use your latest version of visual SMA (VisualIndicatorsTest5) within another indicator.
Red line represents NewVisualSMA.
Blue line represents NewVisualSMA data series when called from another indicator with identical parameters.
I'm doing something wrong? Or the data series doesnt reflect exact plot values?
Thanks
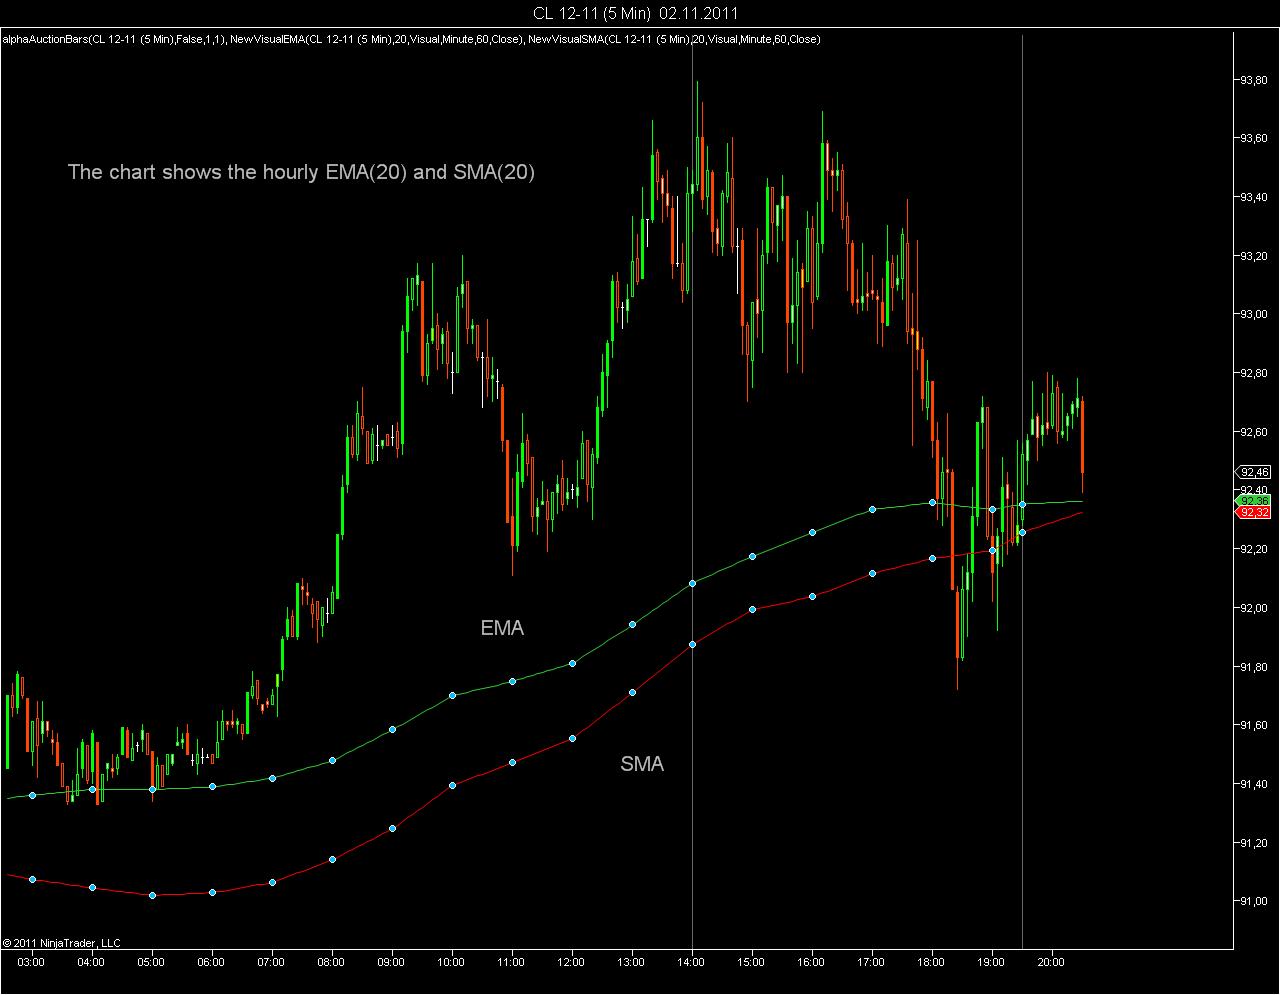
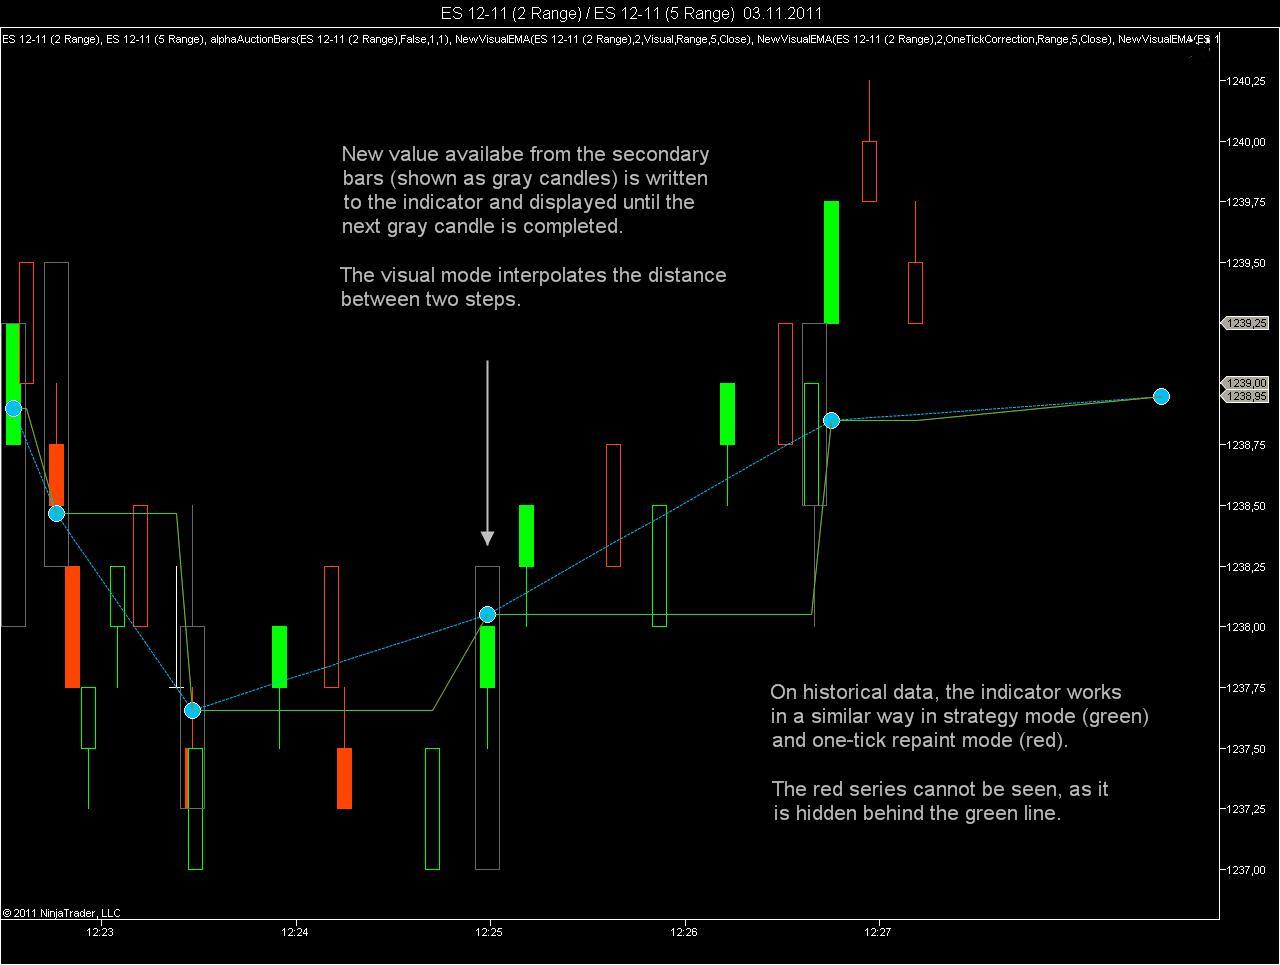
@Erez: This is as expected, but thank you for putting up this question. The VisualEMA and VisualSMA have three different ways of displaying the moving average, which are Strategy Mode, One-Tick-Repainting Mode and Visual Mode. These three modes work in a different way. For showing the difference I have added two charts below, which shows the VisualEMA in Strategy Mode (green), One Tick Repaint Mode (red) and VisualMode (blue).
Strategy Mode: Whenever the indicator detects a new bar close for the secondary bar series, it will write the moving average value associated with the bar close to the DataSeries which will be used to plot the indicator. The indicator is therefore displayed as a step series. The indicator does not repaint in strategy mode.
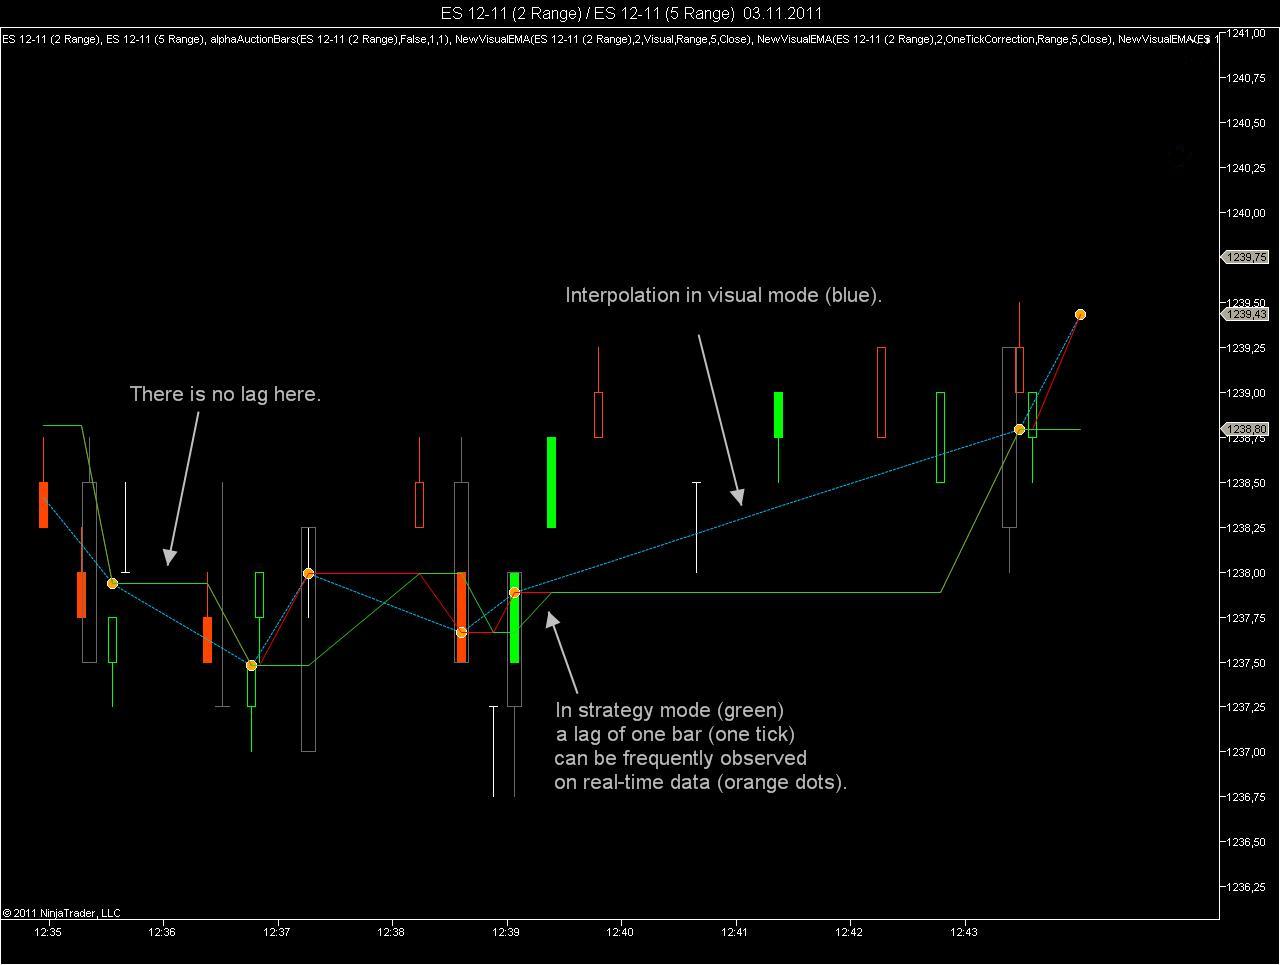
One-Tick-Repainting Mode: For historical data this mode is similar as the strategy mode. However, on real-time data, the close of the bar (other than tick and volume bars, where you could use a counter) can only be detected with the first tick of the next bar. At that stage the prior value of the moving average calculated from the secondary is painted back one tick to the previous bar. This one tick repainting is not done to introduce a hindsight bias, but to compensate for one of the shortcomings of the event driven architecture of NinjaTrader.
Visual Mode: The visual mode is based on the one-tick-repainting mode. However it interpolates the distance between to steps of the step function. In doing this the exact visual appearance of the original other timeframe indicator is obtained. This interpolation requires that the indicator paints back from the current node (shown as blue or orange dot on the chart) to the previous node. This painting back is the exact equivalent of what NinjaTrader does with the current unstable period, if you set any indicator to CalculateOnBarClose = false.
Calling the VisualEMA or VisualSMA by another indicator or from within a strategy
The backpainting is only conceived as a visual aid for the discretionary trader. The real-time gain in one-tick-repaint mode is 1 tick, which results in a lag compensation of 1 bar. In visual mode the backpainting is only used for the distance back to the last node as represented by a blue or orange dot. I believe that the repainting issues are creating problems, if you wish to call the indicator from another indicator or strategy. This would require updating of prior values of your indicators as well. For that reason and to avoid confusion, the indicator will automatically switch to strategy mode, if it is called. The one-tick gain on real-time data is not worth the confusion created, and the visual interpolation is not necessary, if the indicator is used within the context of a strategy.
Thanks for this detailed explanation, I'm aware of to repainting issue after bar is close in secondary series.
I'm trying to do some calculation on this MTF line, but this can be done only on visual mode data series, this data also required to display the visual mode line as is.
Can you release experimental version with exposed visual mode data series?
I assume I can add some code in my indicator, to recognize these events of repaint and sync with it.
Thanks
@Erez: I am not posting this publicly, because I know that there will be a huge number of issues.
If you are interested send me a private message and I will produce a specific version for you. Basically what would be required is an additional variable, which needs to be exposed and will allow you to catch the current value for the numbers of bars that are being painted back. Then you have the information, how many bars you need to set when calling the indicator.
@prisonbreaker82: I can save the template here. Do not really know, what causes your problem. If you wish contact me via private message, so that I can have a look at your chart template.
My focus is now on getting the indicator right. This is a trade-off between accuracy, speed and robustness. Colors, alerts and the capability of sending an alert to your coffee machine will come later. :becky: I am grinding this slowly at my own spee …
First comes the indicator.
Colors and alerts and the capability of sending an e-mail to your girl friend, when the moving average is sloping upwards will come later.