Welcome to NexusFi: the best trading community on the planet, with over 150,000 members Sign Up Now for Free
Genuine reviews from real traders, not fake reviews from stealth vendors
Quality education from leading professional traders
We are a friendly, helpful, and positive community
We do not tolerate rude behavior, trolling, or vendors advertising in posts
We are here to help, just let us know what you need
You'll need to register in order to view the content of the threads and start contributing to our community. It's free for basic access, or support us by becoming an Elite Member -- see if you qualify for a discount below.
-- Big Mike, Site Administrator
(If you already have an account, login at the top of the page)
I have had a look at the ADXVMA, but do not yet understand how it works. It starts with an approach similar to the Chande Momentum, but then takes a different road by using an EMA(EMA) instead of an SMA. So it will adapt slower to the trend and show a smoother curve.
What is the basic idea of the ADXVMA, I mean what did the author try to achieve?
I understand that it detects longer sidewards periods, by I cannot easily use those for the DeviationStop, as the latter always is supposed to be either positive or negative.
I looked at Kase's indicators in the past (just via her vids) and I was never sure why she chose the MA's as her criteria. If anything, I would have thought she would use her Permission Stochastic rules (which, as far as I could tell, is just a stoch based on her synthetic bars). I'm not even sure it would make a difference in the outcomes, but it seemed to me that it would have been a more consistent approach to use her own filter.
Why is it every time I google something / bigmiketrading I find a page written by FATAILS... Thanks FATTY, you da man,,,, hope your genius is paying you right... btw,,,., I'm living up in BC, Canada, in the mountains, hundreds of black bears in my little valley, like your pics!! I take real ones though,,hahah...lol
Hey Fat Tails, I was wondering if it doesn't take you too long, as I haven't taken the time to learn C#, yet, if there is a quick code for an indicator measuring absolute ATR.... I'd like to take some measurements across the asset price measurement... unfortunately without the coding competence I'm visual... thanks dude....
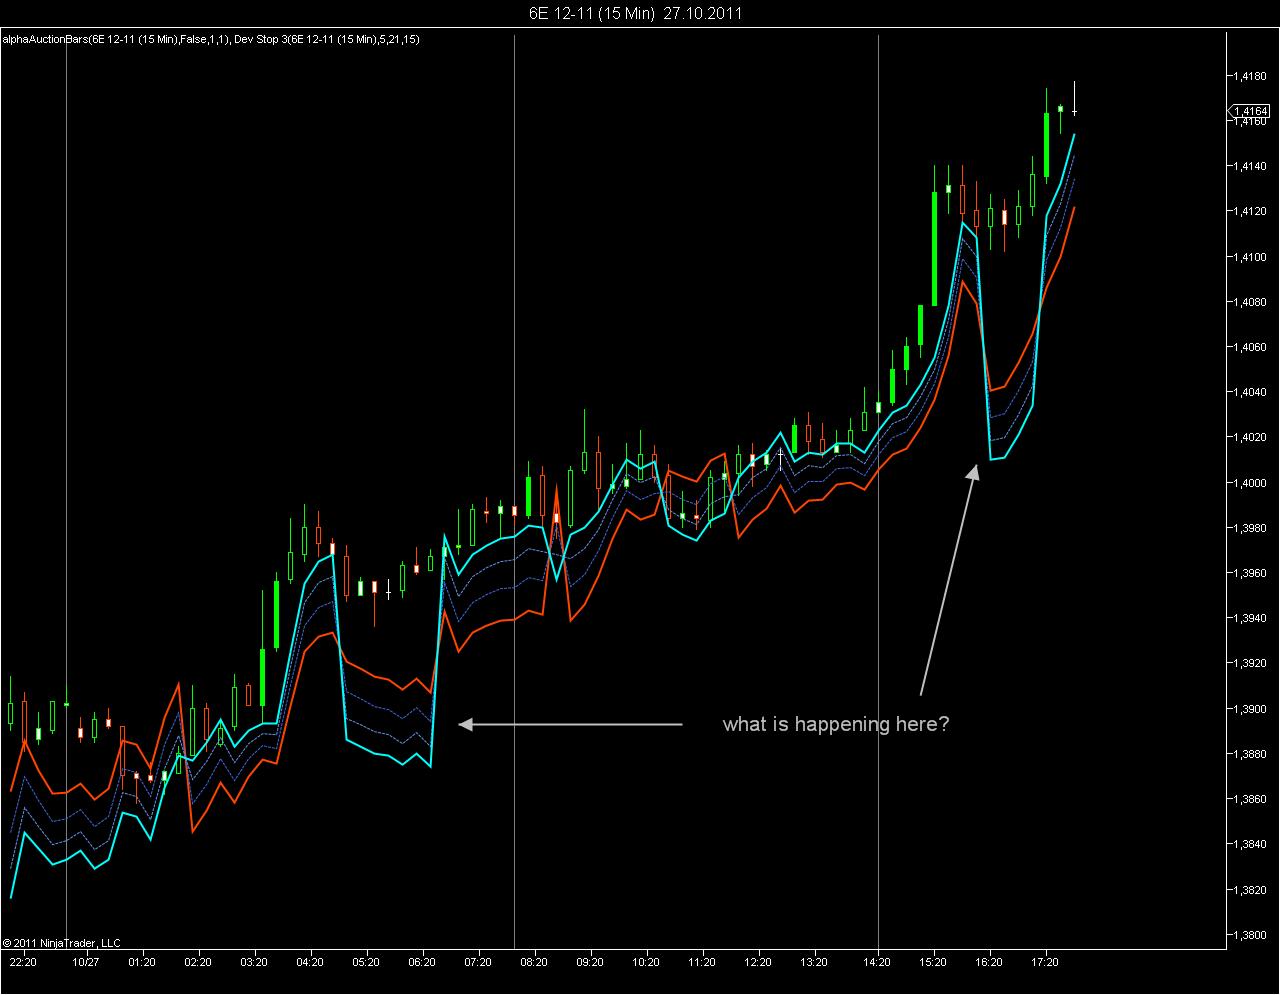
@Zondor: I have seen your version of the Kase DevStop indicator in the Downloads. As I had been playing around with the DevStop some months ago, I could not resist to compare the two indicators. I had never really finished my version, because I was not satisfied with the trendfilter, which is one of the weaknesses of the original concept by Cynthia Kase.
I also noticed that you used the low lag moving average LLMA, but have not yet studied the code. Also I do not exactly remember what I have coded some time ago.
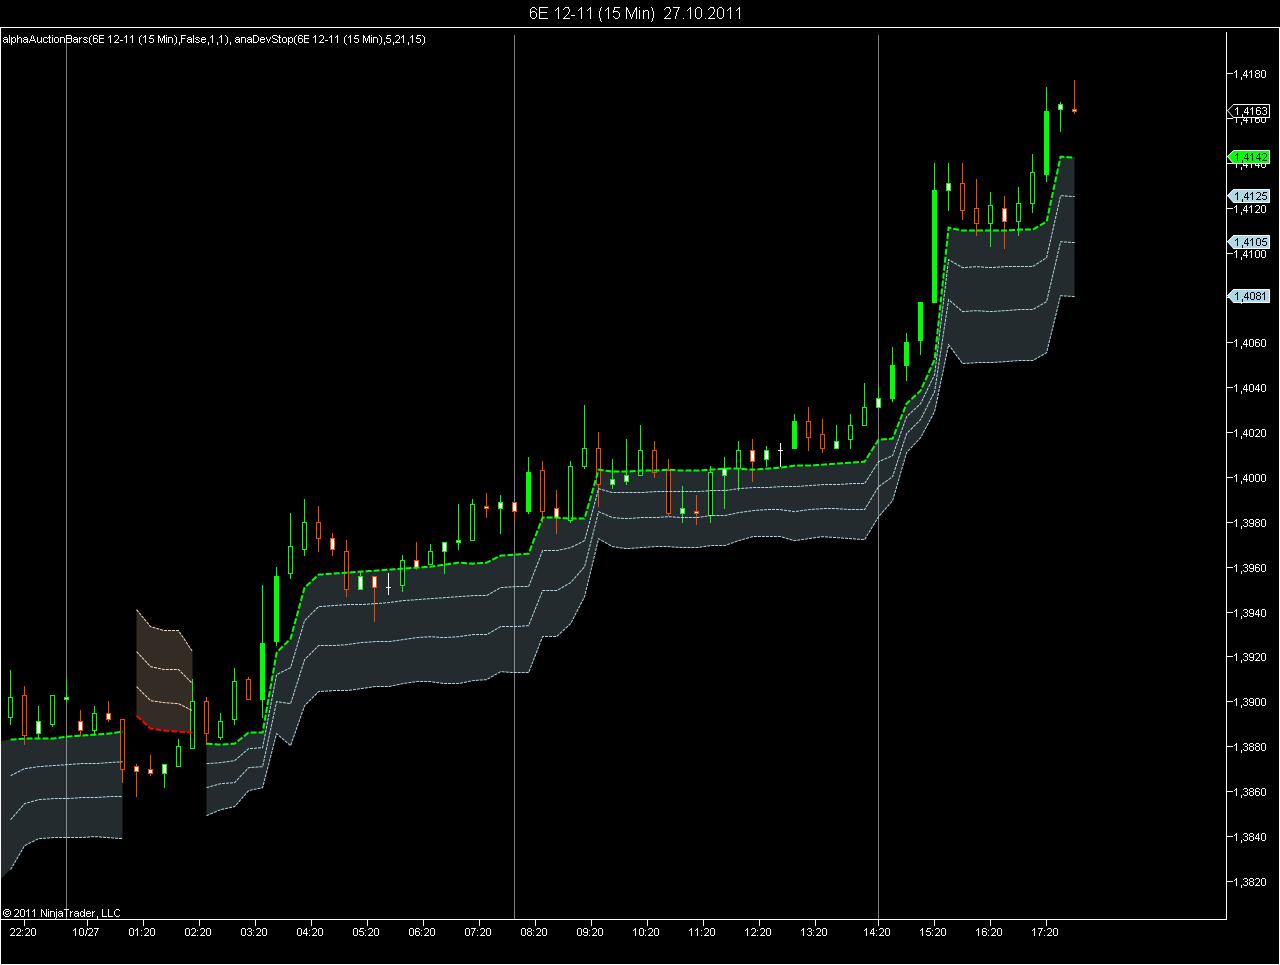
Just to start, I have put the two indicators on a 15 minute chart for 6E and simply compared them. Both use the settings
5 and 15 for the fast and the slow moving average and 21 for the volatility period. There is a noticeable difference.
Maybe we can join forces and put something together which is better than the original DevStop.
The indicators can be found here, if anyone wants to test them and leave a comment.
Harry, I did not realize that you had coded this. My version was just a quick application of coding optimization technques to the indicator that I found on the Ninja forum, without givng too much thought to anything other than the optimization.
The plots of the anaDevStop look much more plausible and useful, and its code is very well optimized.
Richard, thanks for your friendly words, I am clever enough to know that the indicator is not optimized.
It was just a result of playing around a little with the concept. Also it is certainly NOT a correct implementation of the original DevStop. The idea of that indicator was to add a confidence interval to the standard deviation, so it is based on statistical analysis. There is some extra effort going into this, which also uses the CPU, and I am not sure that it is worth the extra effort.
By the way, if any indicator is to be optimized, the most critical point is to adapt it to running on real-time data. This applies to all channels and bands. Let me just take an example:
Bollinger Bands were originally applied to daily data, and the chartist calculated them after the close. This concept is certainly not made to be used on real-time data. If you set the indicator to CalculateOnBarClose = false , it will recalculate the standard deviation with every incoming tick, which is nonsense.
The Bollinger Band indicator - and this basically applies to all channel indicators - should therefore be modified in a way that it does not use current price for its calculation. Still I want to use the current value to trigger visual or sound alert, so I do not want to set the entire indicator to CalculateOnBarClose = true, but just the part that calculates the SMA and the bands. So it would be ideal to displace the Bollinger by one bar forward, or in case you want to add alerts, just to perform all calculations for the previous bar, when the first tick of the current bar is detected.
I have also used this concept now for multi-timeframe indicators, in particular the VWAP. Load a second bar series of 1-minute data and only let the indicator calculate once every minute, so it will not create any CPU load during any news release. The 1-min resolution is more important that recalculating it with every incoming tick.
Also the use of current price for recalculating a channel creates a feedback loop, price approaches the channel and the channel moves away from price, what should this be good for? I would prefer a stable channel to have a better feeling when price will hit it.
Just a note -- Kase has contacted me recently requesting that indicators not use their name. I'm still trying to work things out with them, but if this indicator is not a "correct implementation" then I would call it something else going forward please.
I understand, if Cynthia Kase does not want if we use her name, that is "Kase". But would she disagree, if we use the name DeviationStop? After all she just modified the Chandelier Stop by adding standard deviation bands. And then to who goes the credit?
-> to Welles Wilder who came up with the Average True Range
-> to Charles LeBeau who promoted the Chandelier Stop
-> to Cynthia Kase who added a Standard Deviation Band to the Chandelier Stop
This is all a bit of simple high school mathematics and some people just overestimate their own contributions. In German I would call them "Kleingeiste", translated ot English "small minds", but not fully reflecting the German word, as "Geist" can also be interpreted as "ghost".
Imagine Welles Wilder coming round the corner and claiming ownership for the RSI, ATR and the ADX. Maybe I will then get a patent for a specific use of the standard deviation and not allow people to use it anymore.
Cynthia Kase has repeatedly published the formula for the DevStop. If she does not want other people to use it, she should not have published it. The weakness of the indicator is the trendfilter that it uses. It is miserable, so in the end I will produce something different and call it a different name.