Welcome to NexusFi: the best trading community on the planet, with over 150,000 members Sign Up Now for Free
Genuine reviews from real traders, not fake reviews from stealth vendors
Quality education from leading professional traders
We are a friendly, helpful, and positive community
We do not tolerate rude behavior, trolling, or vendors advertising in posts
We are here to help, just let us know what you need
You'll need to register in order to view the content of the threads and start contributing to our community. It's free for basic access, or support us by becoming an Elite Member -- see if you qualify for a discount below.
-- Big Mike, Site Administrator
(If you already have an account, login at the top of the page)
If I I had to pick an indicator I think it would be Fat Tail's Noise and Volatility bands. The Euro just tends to gravitate to those bands like no other. The other would be to have an open and calm and peaceful mind.
Broker: Advantage, Trading Technologies, OptionsCity, IQ Feed
Trading: CL, NG
Posts: 1,038 since Jul 2010
Thanks Given: 1,713
Thanks Received: 3,863
Gom Volume Ladder comes to mind for me. Indicators should only serve as confirmation into what you're seeing in price action of course. The volume ladder allows you to see under the hood as things are unfolding. VWAP and SD levels are right up there though.
Oooh, this is so simple. MTP's EW tool - one tool allows me to continue to frame price action into the waves I like (via both MTP logic or my own if I wish to change it). And that is the bulk of my trading. But the real deal is that with the same one click I can continue to use position sizing, stops and reward objectives.
Well.... I have to admit I don't really like indicators,but EMA100 has been a boon for me this year in 6E and ES.
My current giggle is 6E 4H . I close every day and reopen to pick up +/- 20 pips...tripped up badly Tuesday when it did not give me +20. Cost me 100 potential profit
Personally, I prefer to trade bonds price action to ES and use a R1 or S1 to cover.
Probably Bollingers, because I can't compute them manually as easily, and I like to see when things deviate beyond the norm. However, the one I use the most is ATR, I like to see how volatile the market is and size targets and stops accordingly so I can gauge what to expect from the market in terms of the size of movements. I also look at ranges a lot, and previous day OHLC, like to see gaps and take longs above yesterday's close and short's below yesterday's close, but those are just lines/levels that can be easily drawn manually. Donchians too, see if we're making new highs/lows over a given period.


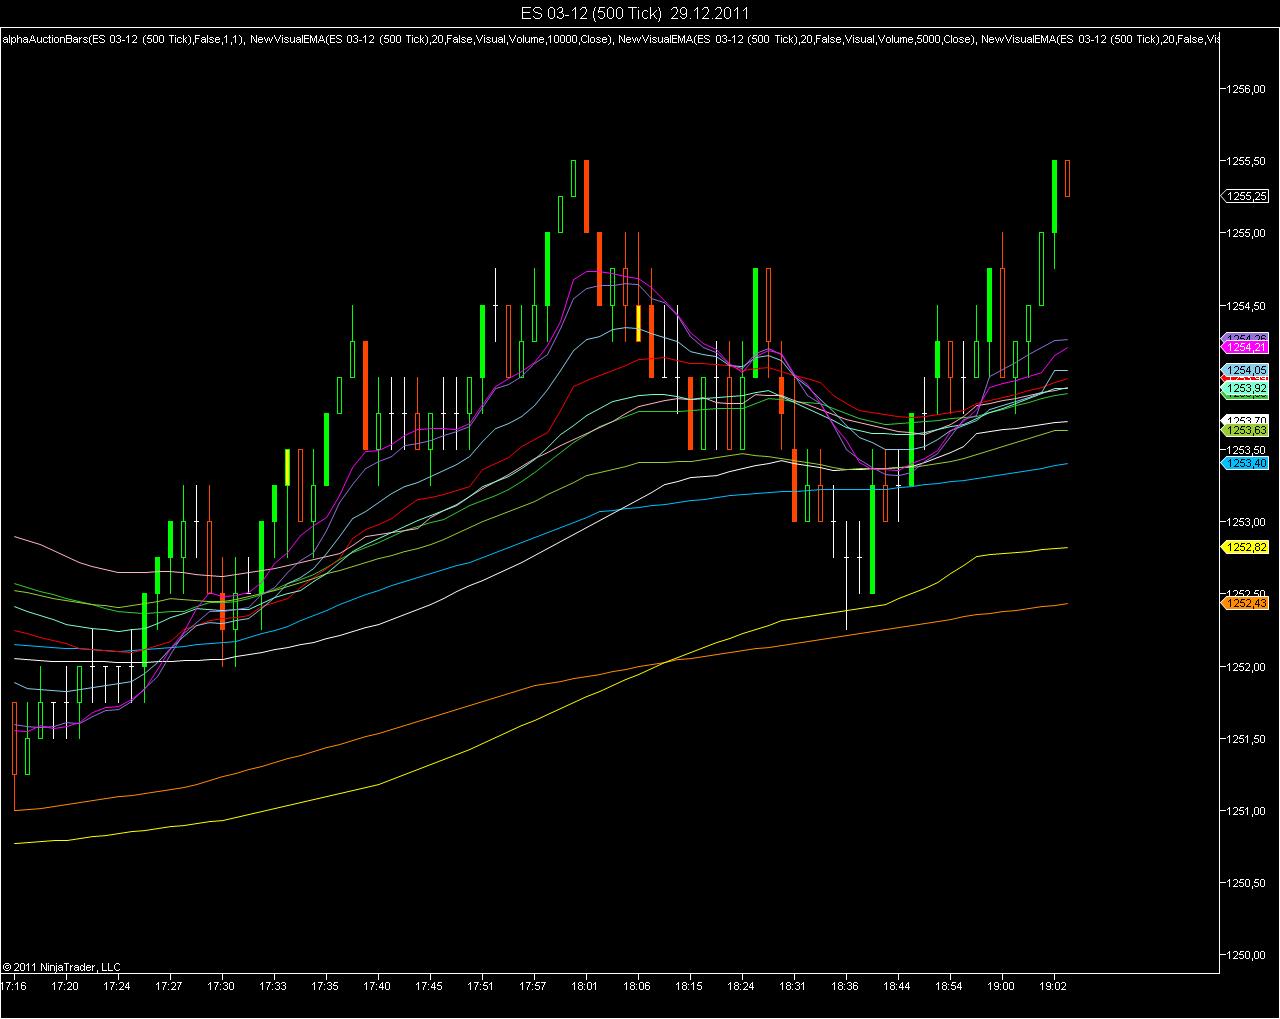
 ....enough for me..neat n clean..

 ) bt cant do w/o.