Welcome to NexusFi: the best trading community on the planet, with over 150,000 members Sign Up Now for Free
Genuine reviews from real traders, not fake reviews from stealth vendors
Quality education from leading professional traders
We are a friendly, helpful, and positive community
We do not tolerate rude behavior, trolling, or vendors advertising in posts
We are here to help, just let us know what you need
You'll need to register in order to view the content of the threads and start contributing to our community. It's free for basic access, or support us by becoming an Elite Member -- see if you qualify for a discount below.
-- Big Mike, Site Administrator
(If you already have an account, login at the top of the page)
Indeed. If, for example, you are Swiss and bought your gold/silver a couple of years ago you'd be sitting very pretty now.
The dollar is going down the pan atm. All western economies/currencies have similar problems - but the US govt seem to be doing the least in terms of deficit reduction. Devalue/print/inflate seems like the only plan in town (for the UK too).
Can you help answer these questions from other members on NexusFi?
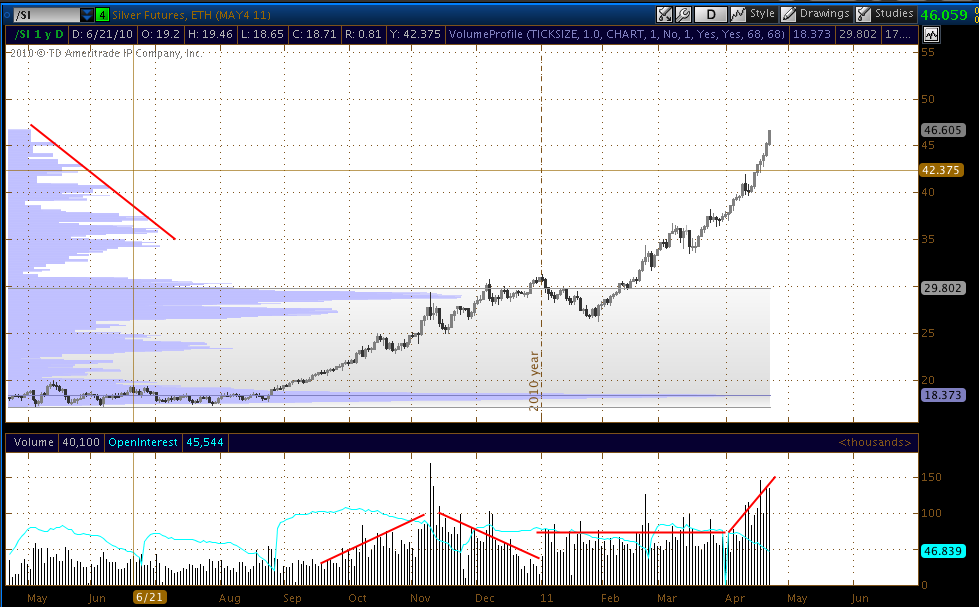
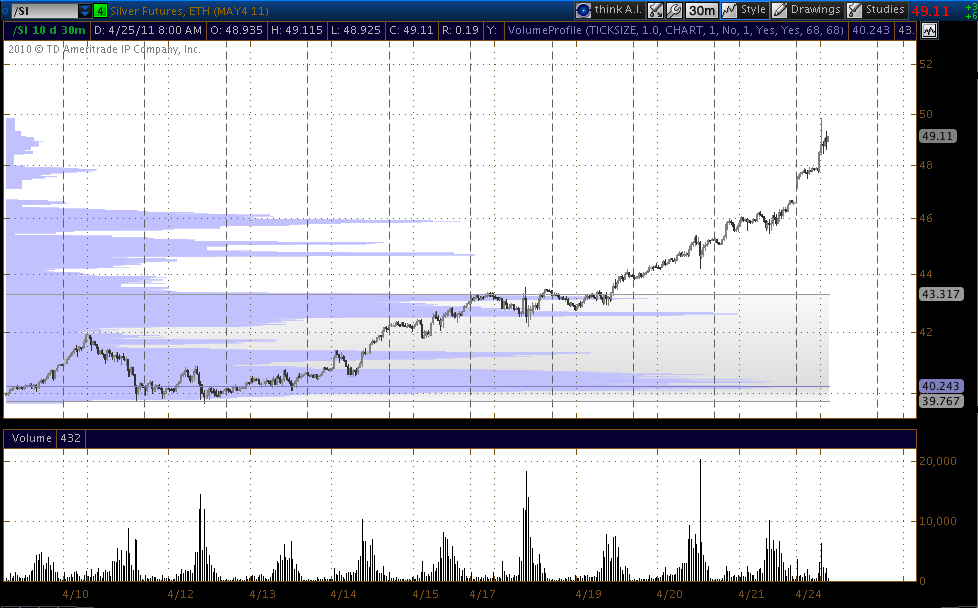
The blue bands running across this chart show magnitude of volume for each price level, so the further the blue bands are to the right, the higher the volume traded at that price level. It shows volume plotted in profile across price.
Using the volume shown at the bottom of the chart, since the start of the year it appears to have been generally constant and around the start of April has accelerated higher. It looks very bullish. Contrast this to the volume profile, it's trending lower as the price has accelerated from $37 until $46, and I take that to be bearish for this move.
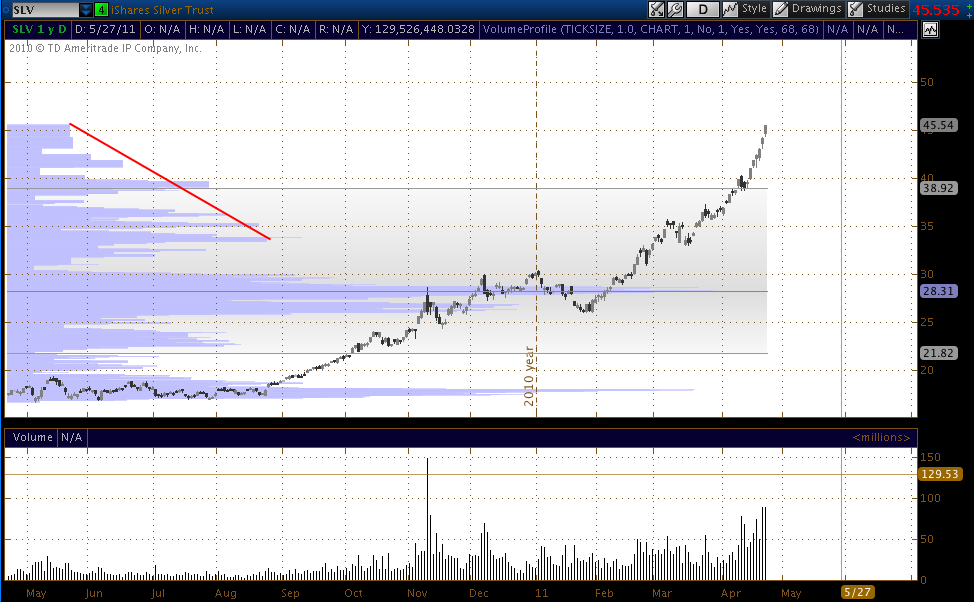
We see the same traits in SLV and SIVR.
SLV
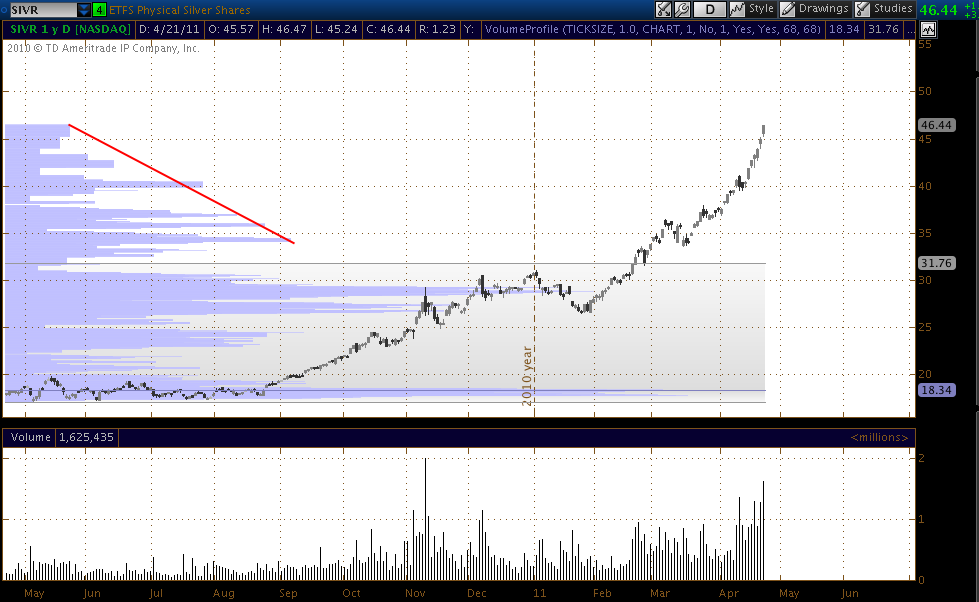
SIVR
This leads me to think that from $37 upwards, the activity in the market may have been speculative. I'm a silver bull, but I would prefer to see a market shake out, and a more consistent price appreciation. Silver has gone up more than 250% in 8 months.
A comment I saw on Zerohedge;
28% premium is excessive.
Also;
"$1,000 OUNCE SILVER IS CONSERVATIVE" (Really?)Only in a hyper-inflationary event.
There seems to be a detachment from reality here, it reminds me of the wild high estimates of oil during the spectacular 2008 rally.
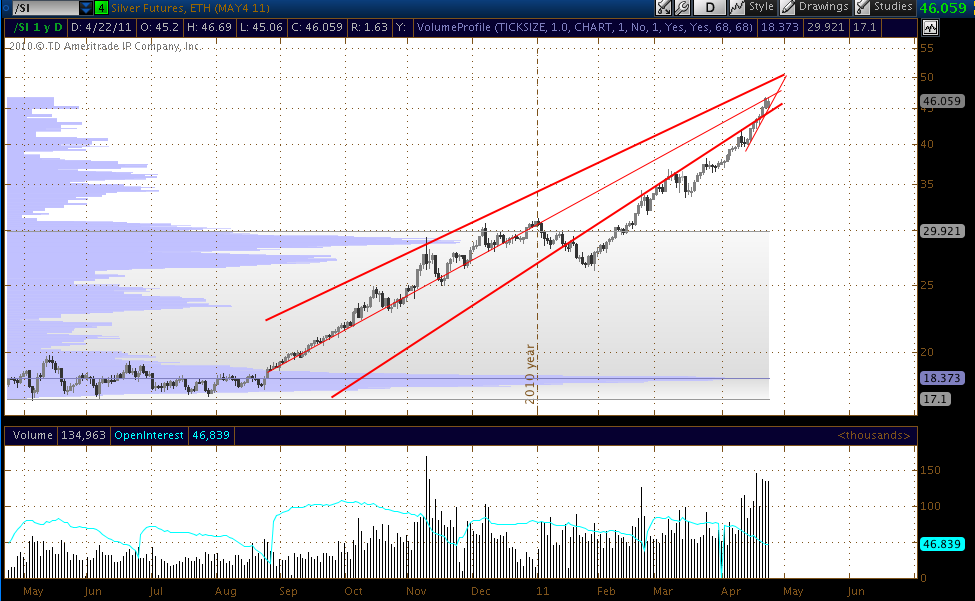
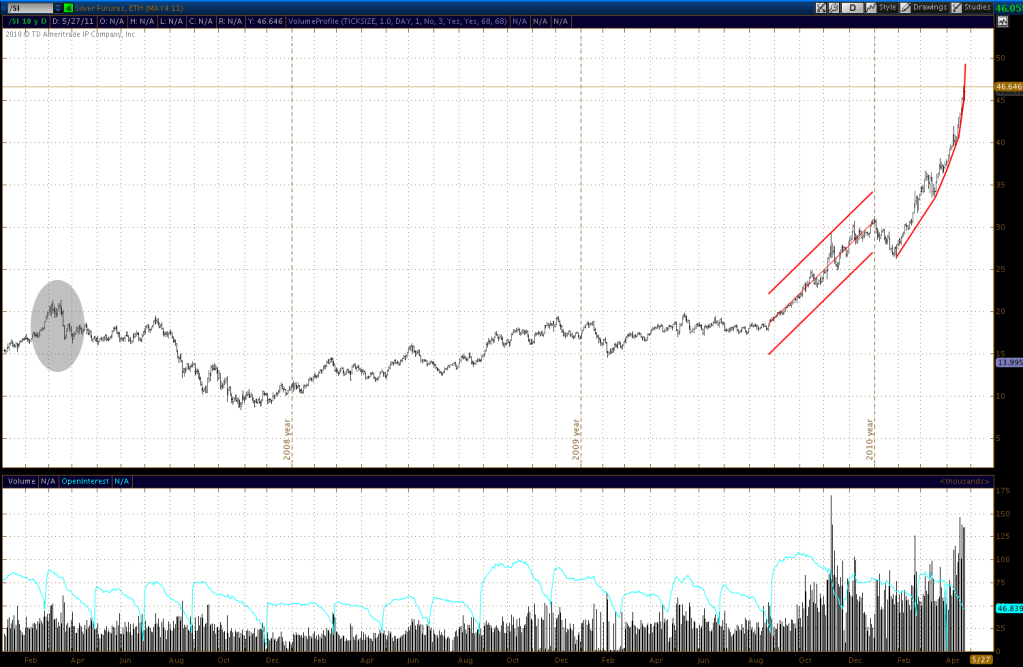
The chart above is a log chart. The trendlines shown are ones that my platform has calculated using linear regression, taking the sustained rise from 25th August 2010 to 1st January 2011 as a base to calculate from. Trend channels calculated on a log chart always converge to some degree to take into account the change in perspective shown on a log chart. Based on linear regression and the recent upward trend, these point to $50 before the end of April. I am not saying that's the top however if the price trend gets even steeper then that will suggest a blow-off top, not necessarily the top though.
Also sentiment on Silver is very high;
Sentiment is higher than it was in March 2008;
Silver futures 2008 - present
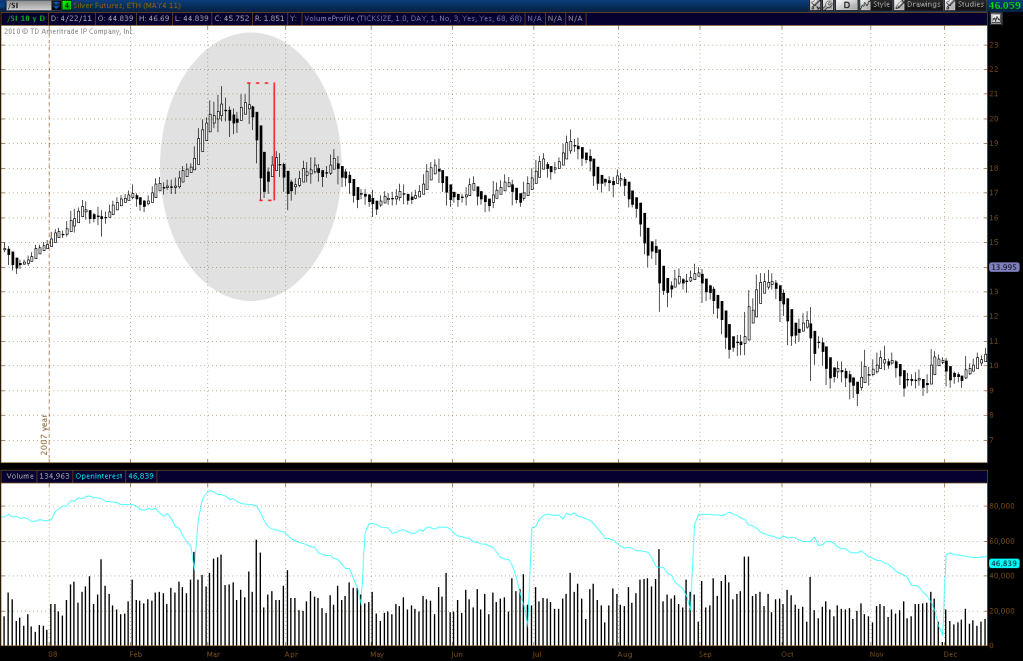
Looking closer at March 2008, after the sharp rise in silver it corrected 22% within 4 days from the high. If it tags $48.70 and corrects the same % it would come back to $38.
Silver futures 2008
"The primary thing required to obtain what you want from life, is simply the will to pursue it, and the faith to believe it is possible." - Author Unknown
"The ability to maintain discipline and stick to the rules is the hallmark of the experienced successful trader" - Curtis Faith
Seven weeks later..
Ok well silver has smoked past $42 and on the chart below I would have entered $46.40 and you can see that is done as well. Where to next?
Naturally, a retracement can happen at any time, but nothing showing yet. I've penciled in $50.40 as the next target but really I have no way of estimating the high. (The rate of projection of the March 13 post has us at $50.18)
The last of the 4 posts of 13 march had: "So there you go. Not sure if it helps.
(in a bull market just buy - )"
I guess that still holds! -in a bull market just buy!
( $10.5 dollars higher in only 7 weeks!)
I would say that the cumulative volume (shown by the volume profile) will always drop off when a contract moves into new high ground. If the vertical lines are at the months, then looking at the month of Dec 2010 you'll notice the up and down consolidating price movement within a range causing the cum. vol spike.
The pullback in mid-march caused the next spike and then the smaller pullback in early April a smaller spike.
As you move into new high ground most of the timid bulls have sold and everyone is seeing higher values on their holdings so selling drops and price gains can come on small volumes.
---------
Re pullback
I would say a pullback to the trendline is about all we can expect ($42-40) at this time.
What are you guys thinking about for stops. I'm really at a loss here. Over 49 and the 5 min chart looks like a stair case. Symmetrical triangle since 1am.
I think the price action bears a resemblance to action seen before previous tops in silver;
Silver futures March 14th to present - non log
The price has risen 22.5% in the last 10 trading days.
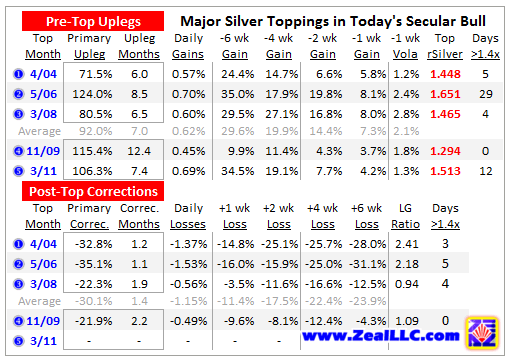
Here are some stats showing price action before and after tops in silver;
The two week gain now is currently 22.5%, and that is more extreme than was seen 2 weeks before the 2006/2008 tops.
It's from an article called , "Silver Toppings". These guys recommended buying silver at $4 in 2001 and again in August last year.
We are not in 2006 or 2008, this market may not play out in the same way but I will be buying SLV puts at the open to hedge my physical silver.
"The primary thing required to obtain what you want from life, is simply the will to pursue it, and the faith to believe it is possible." - Author Unknown
"The ability to maintain discipline and stick to the rules is the hallmark of the experienced successful trader" - Curtis Faith