Welcome to NexusFi: the best trading community on the planet, with over 150,000 members Sign Up Now for Free
Genuine reviews from real traders, not fake reviews from stealth vendors
Quality education from leading professional traders
We are a friendly, helpful, and positive community
We do not tolerate rude behavior, trolling, or vendors advertising in posts
We are here to help, just let us know what you need
You'll need to register in order to view the content of the threads and start contributing to our community. It's free for basic access, or support us by becoming an Elite Member -- see if you qualify for a discount below.
-- Big Mike, Site Administrator
(If you already have an account, login at the top of the page)
10:34 AM 5/9/2013
In this video I'm showing when to use the wider longer anchoring and when to use the shorter.
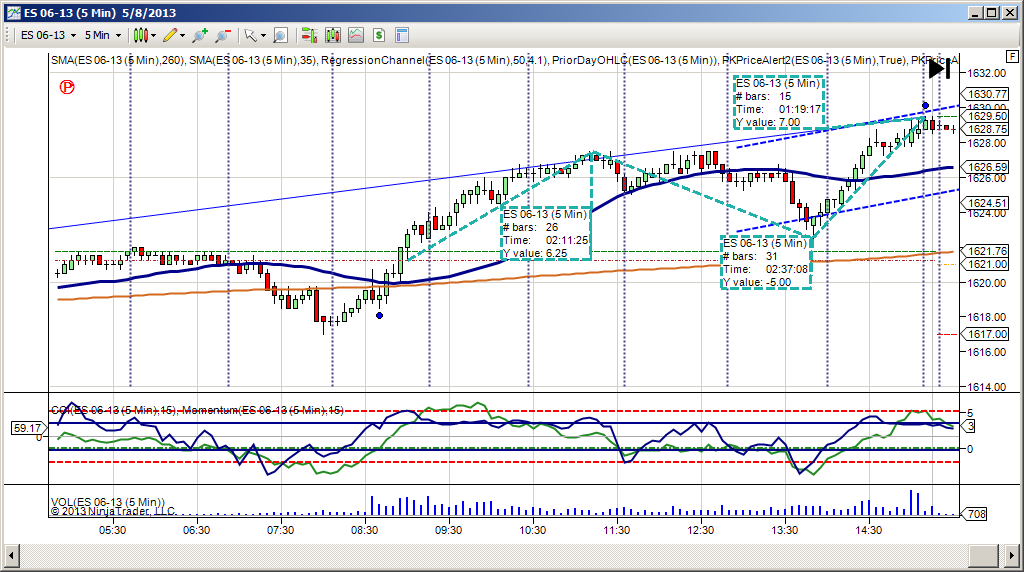
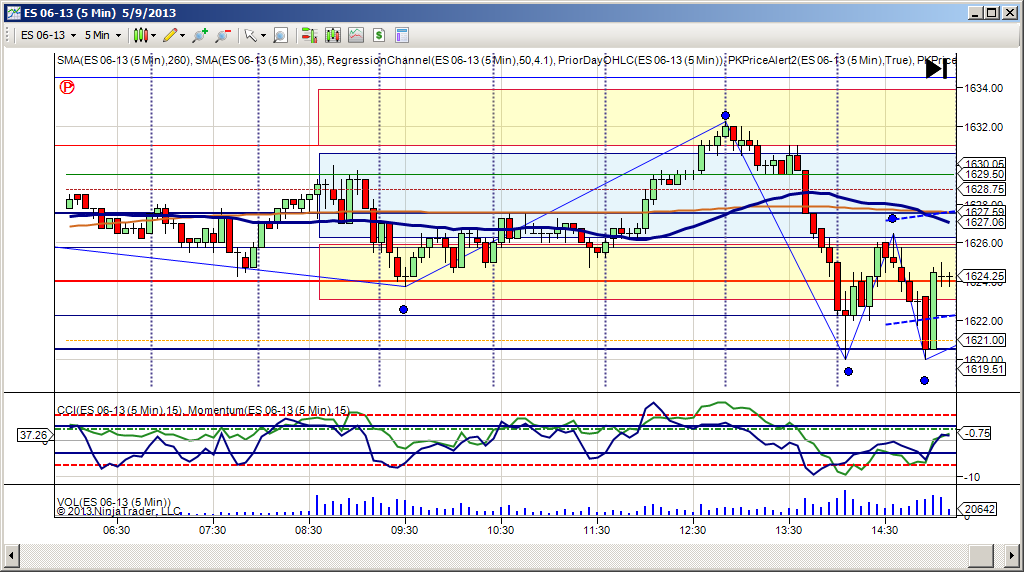
So you anchored from yesterday's low to the o/n high and then this would give you a target for your sell early in the morning H1630 @ 8:42. The 50% was 1624 and the low was 1623.75 @ 9:26. (1624 is your limit sell price as you need the 1 tick to 1623.75 to get a fill).
My estimated range is 8pts for today (8-11pts yest=11pts).
Adding 8 to 1623.75 gives 1631.75.
Subtracting 8 from 1630 gives 1622.
We anchor the retracement/ext tool on 1630 to 1623.75 and get the 1622.25 at the 125%
and conversely -25% gives 1631.50. So the intraday anchoring matches the /- range rectangle.
First of all, daily range study is something I've had problems with. Your 3 period ma of daily range does make a lot of sense and was a kind of eye-opener. It is a simple but powerful technique.
I assume you use your daily range studies to indicate the expansion and contraction of volatility, in other words, moving from contraction phase to expansion and to contraction again. Is it so or is it something else? What kind of signals/behaviour you can read from it and how do you measure the "yesterday's range plus minus x pnts" you mentioned, for example: yday's range was 11 pnts, for tomorrow's range you expect something like 8-11 pnts, not likely more than that. Where does that come from?
One other thing I'm not very familiar with: Most of the time I can see when the day is developing to a choppy day with my market internals in real time. However, I still can't see the link between ON session and CASH session. So what should I pay attention to when analysing ON session? What are the clues?
Time's up. Have to go. Let's get back to business another day. BTW, sorry about my "bad" english. It's not my native language, so might make some errors.
Hi Rad and Ken
Notice that if I had added or subtracted yesterdays range in the example above see post post earlier (the rectangle =11pts vesus 8) how much better the low estmate would have been.
BTW if either of you would like to chime on with replies to Jussi's question on anchoring of fibs please feel free to do so. Also any questions you imagine newr traders would ask on fundamentals. Please keep charts clear and simple as this thread is on fundamentals (nothing exotic and no MP please- thanks).
In brief I have struggled with this and do not yet have a good answer to your question.
I have noticed that contraction of range for a period of time can happen under certain conditions and one is the current situation where we broke to the ceiling …
It is important to practise the skill of looking at the chart and anticipating what might come.
Pattern recognition is a part of this (see Lind R webinar for the imp of pattern recognition).
At the end of the trading day I draw two lines on the chart for my estimate of the HOD and LOD of the RTH.
Here is my result Thurs for Friday.
Below is my first outlook for Monday 1627.50 and 1618.
Here is an example of an alternate scenario where the market falls off in the o/n session. Notice the resistance in light pink (1615). It can hold there or go through. As there have been a series of up days there will be lots of nice juicy sell stops below it so I have chosen that it will break through and go to 1608.75 or lower.
Don't let you mind get locked into your guesses. It is only building an important skill with practice. The same skill will serve you well in the intraday session.
(I'm not a fan of this the new website format - it really makes the inline pics supersmall - on my screen look at the pics in posts above for comparison.
Also it add huge amounts of white space in between - don't blame me I didn't put thme there :) )
Hi @aquarian1
..the picture load problem is due to server change that @Big Mike was doing tonight.
If the problem persists - please report it to him.
As from the last entry in the futures.io (formerly BMT) forum changelog things should run on the new servers
right now.
Thanks for the heads up. I'll upload them tomorrow
Just finished watching a few more minutes of Linda's webinar it's how I chill -ha-hah.
I'm glad you're reading the thread -nice to know!
Your most welcome.
Wishing you a great weekend as well!
I have lots of work to do on new studies and new ideas that have come up during the week.
The main thing for me is getting more sleep!!
in post 44 on my screen the picture comes to the "m" in simple
any questions you imagine newr traders would ask on fundamentals. Please keep charts clear and simple
123456789A123456789B123456789C123456789D12456789E123456789F123456789G123456789H12
so 82 characters.
now they have been re-sized to "super tiny".
------
I guessing the re-size is now done on a ratio basis e.g 25% instead of a pixel basis e.g. 600 wide.
Because I have a small screen this means all my pics might be showing as icon sized, which would be a real discouragement to me. Maybe its just a temporary glitch?