Welcome to NexusFi: the best trading community on the planet, with over 150,000 members Sign Up Now for Free
Genuine reviews from real traders, not fake reviews from stealth vendors
Quality education from leading professional traders
We are a friendly, helpful, and positive community
We do not tolerate rude behavior, trolling, or vendors advertising in posts
We are here to help, just let us know what you need
You'll need to register in order to view the content of the threads and start contributing to our community. It's free for basic access, or support us by becoming an Elite Member -- see if you qualify for a discount below.
-- Big Mike, Site Administrator
(If you already have an account, login at the top of the page)
Mike, could you please test Sierra Chart with your DTN IQ Feed and do these comparisons.
You will need to be very certain though that you are loading an identical number of days into the chart compared to IRT . If you have any questions please let us know. Preferably on our Support Board.
If you need your Sierra Chart account activated, please let us know.
We can assure you though that with the way that Sierra Chart calculates the cumulative Delta, it is 100% accurate. The only issue we are aware of , and this is a subtle issue, is that if you are using chart bars based on Volume. This just has to do with the splitting of data records and the issue of handling that.
If you have tick by tick data and your bars are based on a specific Time, Range or Ticks, you will get 100% accurate results.
I am executing via TT but use DTN for data. There does not seem to be a way to do this in SC without having two installations of SC?
Can you/someone confirm the specifics of the new Cumulative Delta Bars study --- is this building bid/ask delta based on volume or trades? For the method I was previously using, I need two studies - one built on volume, and one on trades (ticks) as there are important differences.
I use the Cum Delta Bars study but it is based on volume. I also want to have a cum delta based on uptick/downtick as presented in the FT webinar but I have not been able to come up with anything in SC. Here is a link to a SC thread which addresses this issue
@SierraChart
Hi
i set up my study exactly as shown in SC's support board and here
@BigMIke
Hi
apologies , i didn't want be rude ,English isn't my language ,i have to study it more
maybe i didn't understand , you meant CDV or volume ?
if you meant CVD i found the figures different .(little)
i set up CVD daily values on MD and reset at start trading day (YES) on SC.
differences are very small , today BUND in SC 1 minute chart i have - 2678 CVD, BUND in MD shows -2671.
maybe is due to different ways to manage time of the instruments or the timestamp of the ticks?
@crazybears - no you have been helpful, thank you. It's just that I cannot load Investor/RT anymore due to the issue I mentioned, so I am "blind" unable to compare against a known-good source.
That is why I was asking for a daily difference between SC and IRT, using the same session period. Since the absolute total value will not be the same, depending on how many days back each charting app is set to, it is simpler just to do the math on one day.
The new SC built-in study for Cumulative Delta bars is very nice and makes things a lot easier. All I had to do was change the default so it wasn't resetting daily, and modify the bar colors to my liking. So very nice indeed After what I've been through with MultiCharts and CDV, I just wanted to verify against IRT.
@sctrader, thank you. I looked at the thread but will have to look again more closely. I've not used Sierra for charting in many months, and only for a few days back then, so I am having to re-learn everything.
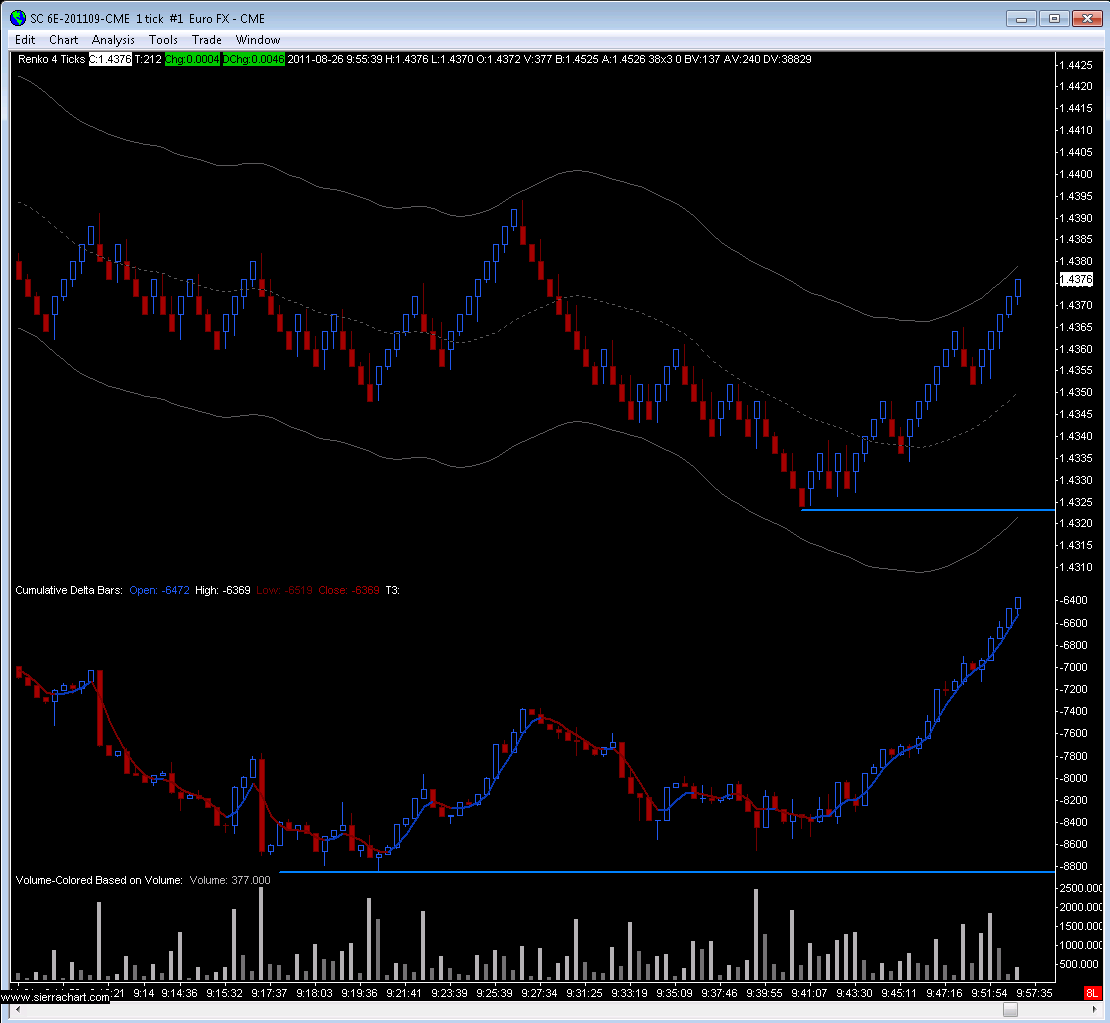
Here is my chart as it stands right now, working to duplicate FulcrumTrader's chart as a baseline.
Hey guys, SierraChart will be joining us again, along with friends from Velocity Futures, to give a more advanced review of their platform and show off some of the more advanced capabilities, as well as answer all of your questions.
thank you for the SC webinar.
I have installed SC - Cumulative Market Delta - with Bid/Ask Volume Difference Numbers Bars
questions. I am using 610t and 144t charts.
1. is the indicator calculating difference in ticks or in contracts?
1.1 -I read somewhere that CD only tracks Market Orders - then I read that this is impossible as the broker does not know the order type submitted. Which is true ?
2. the settings show colors for OHLC and the scale on the right goes from positive thru zero to negative
COLOURS
2.1 when the bar is green, I assume buyers AT THE MOMENT (compared to last bar) are more aggressive than sellers
2.1.1 this is where you would look for divergence. i.e if the price bar is red and the CD bar is green, prepare for price going up. From looking at today's 6E (2011-9-29 7:15:32 PST) I see that this is not always the case.
2.1.2 when the price is ranging wildly but the CD bars are staying pretty flat, this shows indecision in the market.
SCALE
2.2 I assume that when the CD bar is green but the scale shows negative this means that from the start of the day, the cumulative Ticks is in the sellers favor, but because the bar is green AT THE MOMENT buyers are more aggressive.
It tracks only trade volume right now. They are planning to add ticks soon, so you can see the 'pressure' ie "hitting the bid real hard" and then compare that with the actual volume, like what IRT or MD can do.
The latest release also has a horizontal ray tool, so you can quickly mark delta levels with a single click, and then when the line is met, you can cut the line.