Welcome to NexusFi: the best trading community on the planet, with over 150,000 members Sign Up Now for Free
Genuine reviews from real traders, not fake reviews from stealth vendors
Quality education from leading professional traders
We are a friendly, helpful, and positive community
We do not tolerate rude behavior, trolling, or vendors advertising in posts
We are here to help, just let us know what you need
You'll need to register in order to view the content of the threads and start contributing to our community. It's free for basic access, or support us by becoming an Elite Member -- see if you qualify for a discount below.
-- Big Mike, Site Administrator
(If you already have an account, login at the top of the page)
I was looking for a short in a raging upward market. That is not an easy trade. I took the 1st sign of any confirmation, and then expected to have an extremely tight stop for the conditions.
The trade was not timed wrong. The stop did not actually get hit, I expect to close a losing trade before my stop gets hit. But my stop was on the entry wave. Way too agressive for countertrend. I know that, but I still made the mistake.
The day was good, the trades were good. Winners exceeded losers by roughly 2 to 1, and the day was 66% profitable. But, had the 2nd trade been given a more lenient stop psychological area, it would have been a 100% win rate, and potentially 36 ticks more profitable. I just faded my own chart setup, I should know that requires more breathing room.
I am better than I was, I can be better. That is a truth of trading.
Can you help answer these questions from other members on NexusFi?
Gary, was just reading the journal and notice you posted just now. For ES, I have seen you use a 4 range. For your crude 6/9 range, what would your equivalent be for ES? 4/6 or something similar?
Also Gary, for the life of me I can't find your "Holt" (EMA?) .... on the 9 range, it looks like two channels around price. What exactly is this? I've read and reread but can't seem to find exactly what this is or where to get it. I'm using IRT but also have NT and would like to see how it looks.
I do not believe that crude and the ES can share an exact chart setup for smaller timesframes or range because they move so different from each other. I sometimes apply a 6 range chart configuration to a 4 range ES because I like the visual, but they read somewhat different. Crude can take off at a moment's notice and run, where the ES is more of a back and forth motion. For example, the white/black color cange on an ES 4 range, using the same indicator settings as the 6 range crude, gives completely different signals. If you tried to black box the crude "rules" for those indicators, the ES would have completely different performance, and my guess is it would be negative. For the ES I prefer to watch for chart patterns, the 4 range seems to help me do that. Keep in mind I moved away from trading the ES, so my chart setups favor CL.
On the Holt EMA, that has been reduced to only on the 9-range. It was effective on the 6 range, but wanted to run inside price action too much. I played with probably every MA combination available, and have gone to all T3 MAs on the 6 range chart. For me they ride my charts better. The holt I am using on the 9 range I believe is called AaMA. I had one previously that was simply a holt, but I found this on on futures.io (formerly BMT) that is a color changing MA that has multiple choices for the type. My NT is corrupt as of this morning and I have not reloaded it yet, otherwise I could give you the exact settings.
The bands on the 9 range are also on futures.io (formerly BMT), called PRC2 which stands for polynomial regresion channel. That indicator can be very deceiving because it moves after the fact, unlike the donchian channels which stay put. If you look at it, it appears it catches nearly every turn, but that is historical. But I liked the look and use the ranges for confirmation. They are effective as an additional filter, very visual. Just seeing the curve tells you something.
I watched the Ichimoku webinar this week and really liked the simplicity of it. I also was very impressed with Chris Capre's insight and trading style. His emphasis on excercising the mind very much aligned with my beliefs. I plan to watch his webinar again this weekend.
As a bonus, my wife is getting her certification as a yoga instructor right now, so Chris' incorporation of yoga into his daily routine gave me a rare opportunity to have a short conversation with her about trading.
However, I downloaded a few Ichimoku indicators from futures.io (formerly BMT), got them setup on a chart template to my liking, and then after shutting NT down was not able to open it again without it crashing. I tried several corrective steps, including removing the new indicators and the chart templates from the NT folders, and re-installing NT over the existing version.
After running full virus scans from two vendors and coming up with nothing, I removed NT entirely, chart templates and all, and started over this morning. I have everything backed up and will re-create my screen setups, but am not sure where things went wrong.
I don't really trade the ES much anymore, and when I do, I have been using a chart that really has nothing to do with trading the ES. Most of the time I don't even have the ES on my screen. So, if I post an ES charts for the sake of overall market analysis, the indicators on those charts are not typically set to ES motion. I put a lot more emphasis on support and resistance zones for ES setups.
But, when I was serious about ES trading, the chart below was what I considered my main entry chart.
The chart configuration is incredibly simple; a 512 tick chart with a 21EMA and a 100EMA. The price bands are 100 period MA envelopes set at .02 percent intervals, with the outside edge purple lines at .15 percent.
Trading it is not quite as simple as a crossover, but I just thought I would share it after a comment about ES trading. This chart configuration was from before I found nexusfi.com (formerly BMT), and so there may be a much better indicators from a visual approach, but I still found this chart to be very easy to read.
I am a big believer in quality versus quantity, and rewards greater than risk. The confirmation process for that chart that seemed to follow those priorities for me was as follows;
1) Wait for the ES to reach a significant support or resistance zone, preferably in the direction of the overall trend.
2) Wait for the EMA crossover.
3) Enter the trade at the first return to the entry zone after the crossover.
Obviously there are more factors that add strength, such as volume, time of day, etc.
Ninja is reloaded, chart templates reset, workspaces rebuilt, and only the absolutely necessary indicators were brought in this time. I am trying again for an Ichimoku chart. I had it to this point once before and all was well until the next day, when NT would not load.
I am not going to be trading next week, expecting "holiday volume", so this is a perfect time to clean out the system anyway.
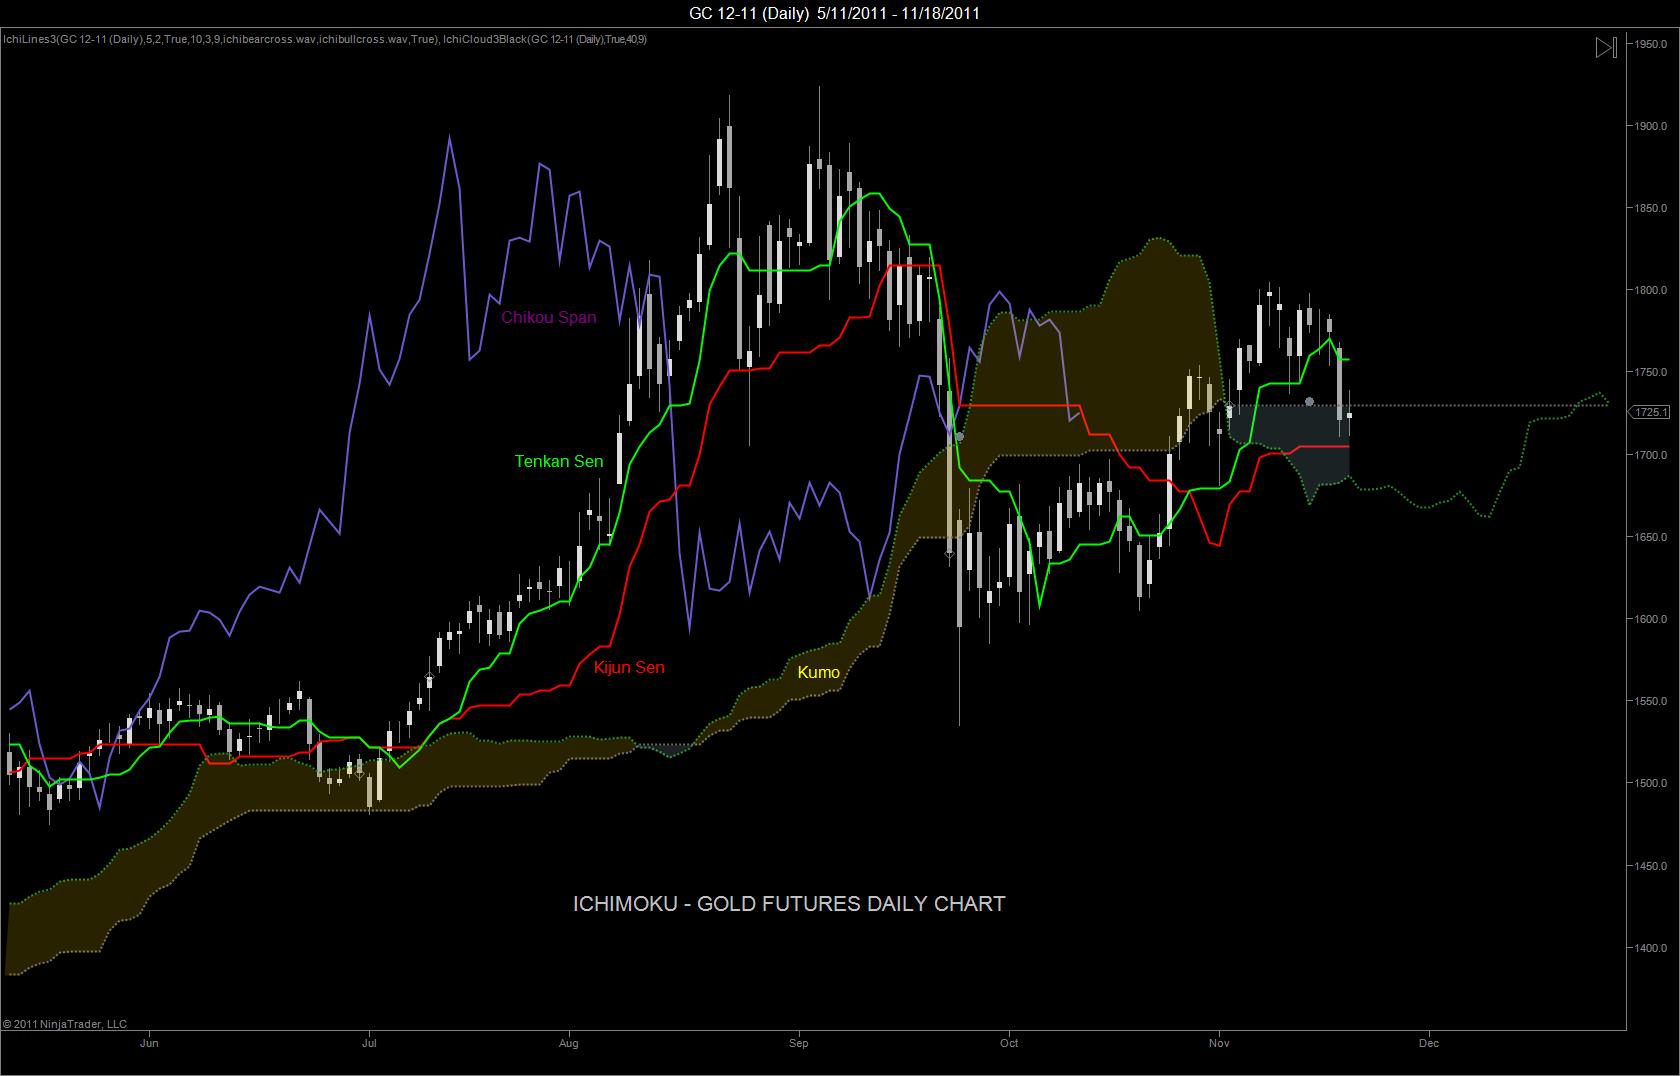
So far, my take is, it looks very distracting when trying to read S/R areas. But I'm going to give it a year as a supplemental analysis tool. My hope is to find additional confluence to current analysis methods. With my limited understanding of it, it appears gold is in a decent buy area on a daily.
[URL=https://nexusfi.com/v/jqux3b.jpg][/URL
And, previous anaysis methods suggest gold could be in the area to complete wave 4 of a 5WM.
Sure, as long as it is not an Elite indicator as this is not an Elite thread/section. If you aren't sure, you can do a search for it as I outlined before and see what subforums it was created in or posted in originally.