Welcome to NexusFi: the best trading community on the planet, with over 150,000 members Sign Up Now for Free
Genuine reviews from real traders, not fake reviews from stealth vendors
Quality education from leading professional traders
We are a friendly, helpful, and positive community
We do not tolerate rude behavior, trolling, or vendors advertising in posts
We are here to help, just let us know what you need
You'll need to register in order to view the content of the threads and start contributing to our community. It's free for basic access, or support us by becoming an Elite Member -- see if you qualify for a discount below.
-- Big Mike, Site Administrator
(If you already have an account, login at the top of the page)
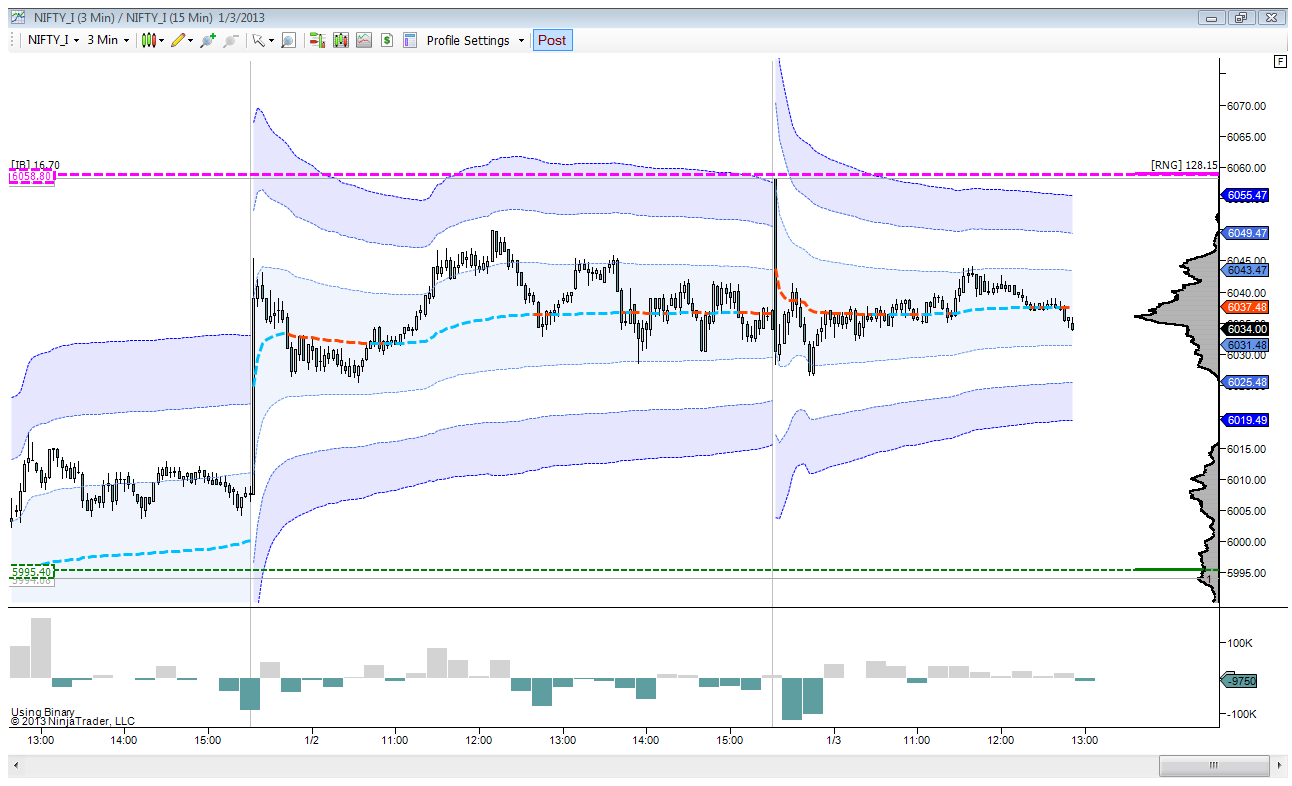
It was not different than yesterday if i compare openings ( though i have been absent during openings since ever my kid's schools are off and i guess it will continue so for this week atleast ) , i just corrected yday mistake but i could not fetch much. Last 3 days openings were single tick...giving illusion of fast open drive , rather all these days were very slow and they were sufficient to give calm massage to my mind - not to be much active. I am feeling, i am becoming more and more momentum affectionate and i act on direct perceived situations or impending ones.
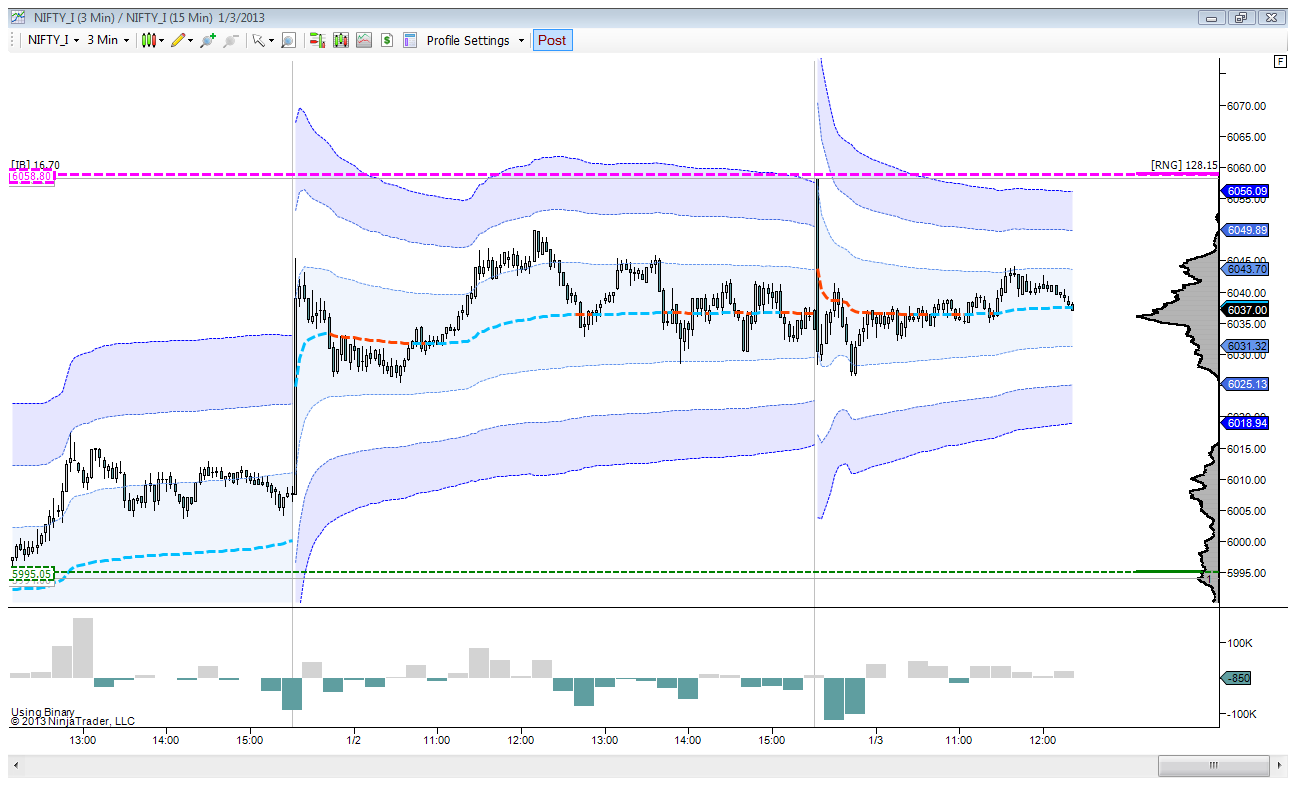
I am posting weekly and daily chart also for quick reference , as i have not done in recent past.
This week closing might fizzle out RSI -divergence...but let this week complete first.
Harvest The Moon Nest The Market
Can you help answer these questions from other members on NexusFi?
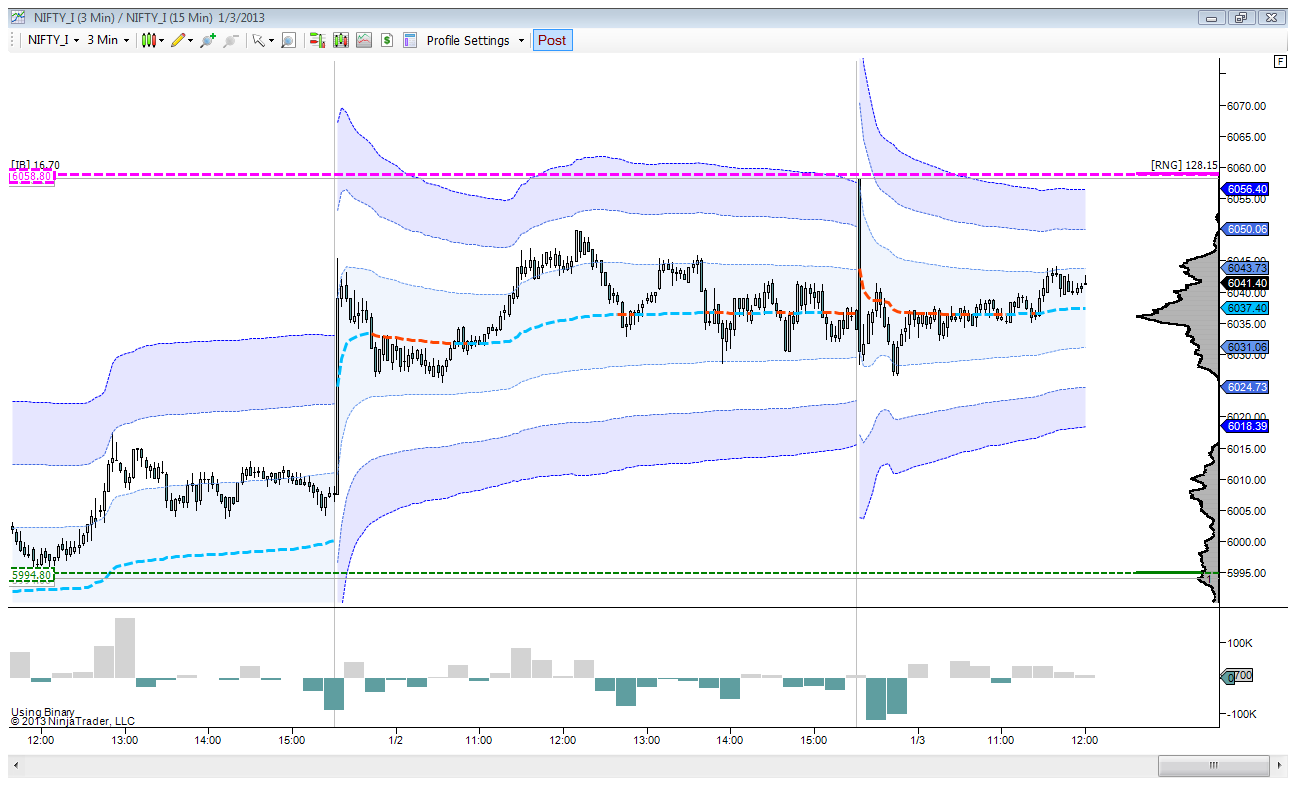
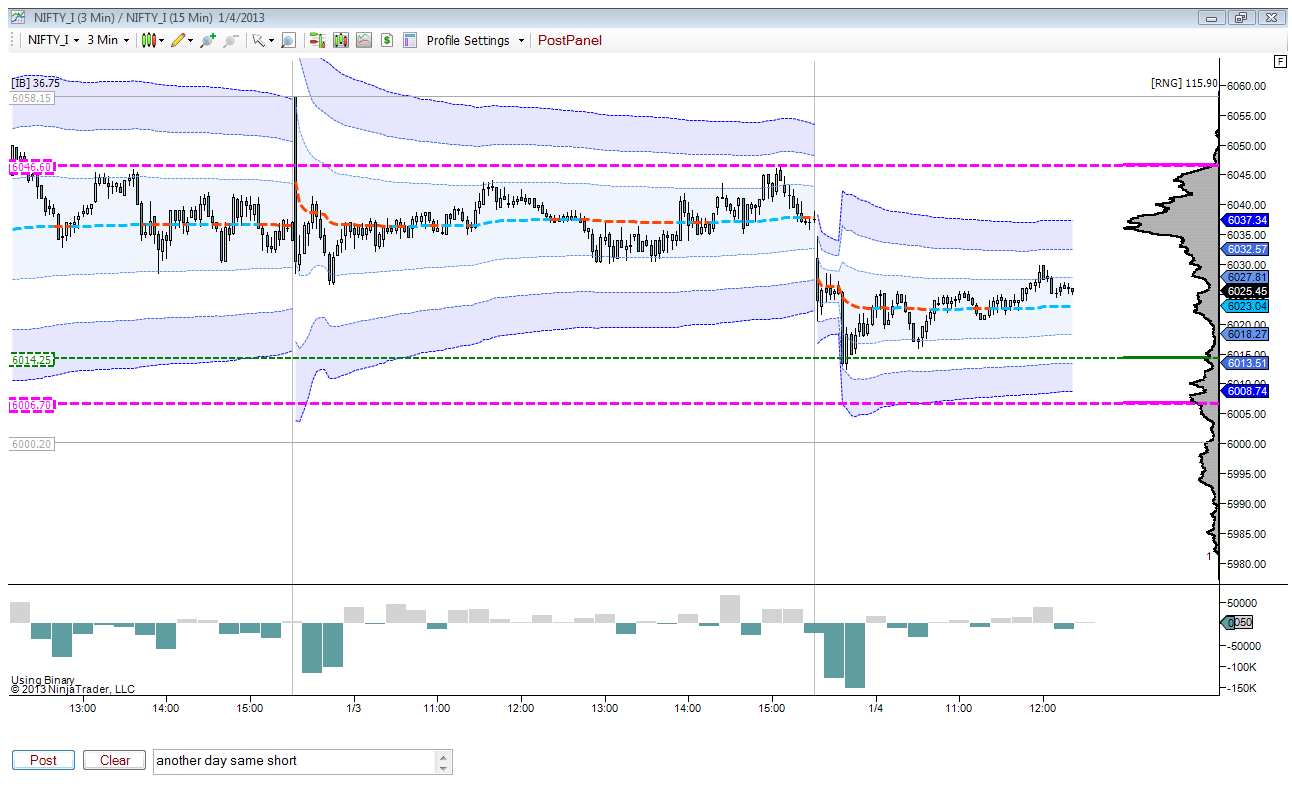
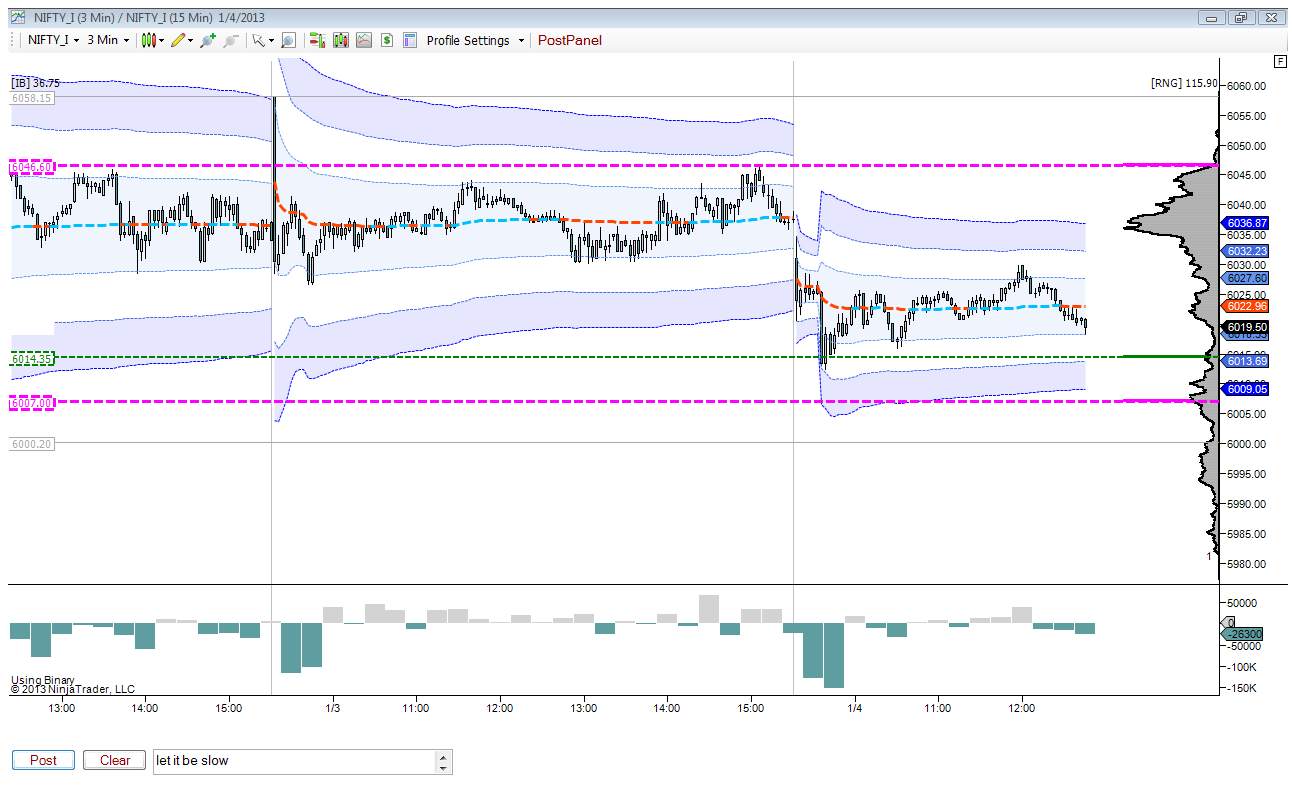
I have been trading on my 3-min and 15-min chart since last 9-10 months and i have good sync with them. Even i am more selective for chart size , x-axis and y - axis scale but most of thing on these two chart have become obsolete for my view, i am only keeping them as not to change anything or just have become habitual to crowd.
Some time i think to merge these two in one, having functionality and expression from both and eliminating obsolete indicators. Below is such a chart with two data series ( 3-min primary and 15 - min secondary and hidden. ) which is still not complete with its component ( i am thinking to deploy 15-min MA with show/hide functionality with a click/hotkey ). Its current component list is as given below,


 I am feeling, i am becoming more and more