Welcome to NexusFi: the best trading community on the planet, with over 150,000 members Sign Up Now for Free
Genuine reviews from real traders, not fake reviews from stealth vendors
Quality education from leading professional traders
We are a friendly, helpful, and positive community
We do not tolerate rude behavior, trolling, or vendors advertising in posts
We are here to help, just let us know what you need
You'll need to register in order to view the content of the threads and start contributing to our community. It's free for basic access, or support us by becoming an Elite Member -- see if you qualify for a discount below.
-- Big Mike, Site Administrator
(If you already have an account, login at the top of the page)
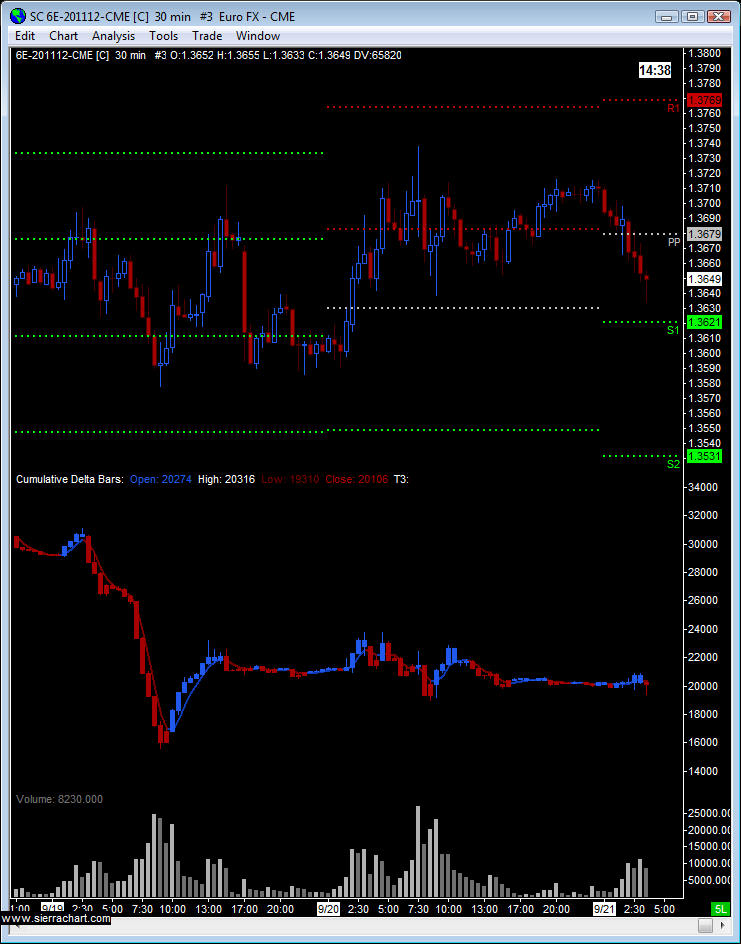
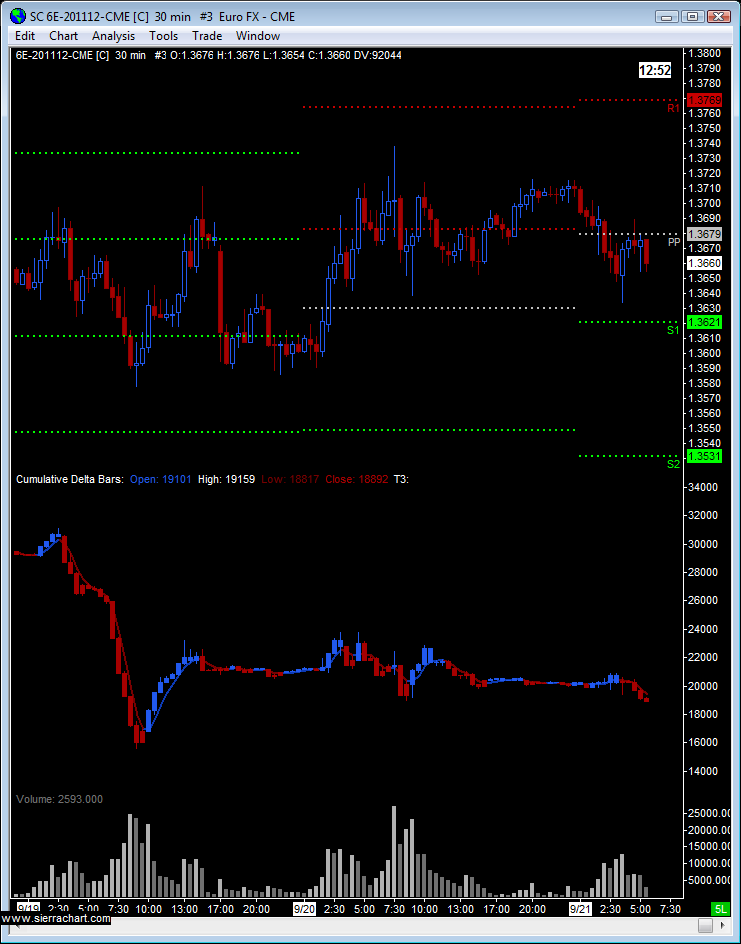
I am not at all crazy about this support at .35 area:
This area has been tested three times now. The prior two times we saw massive buying come in. I am still holding my short, but keeping a close eye. On the other hand, if we can breakdown below this area, it is quite bearish and maybe I'll get my S1 after all.
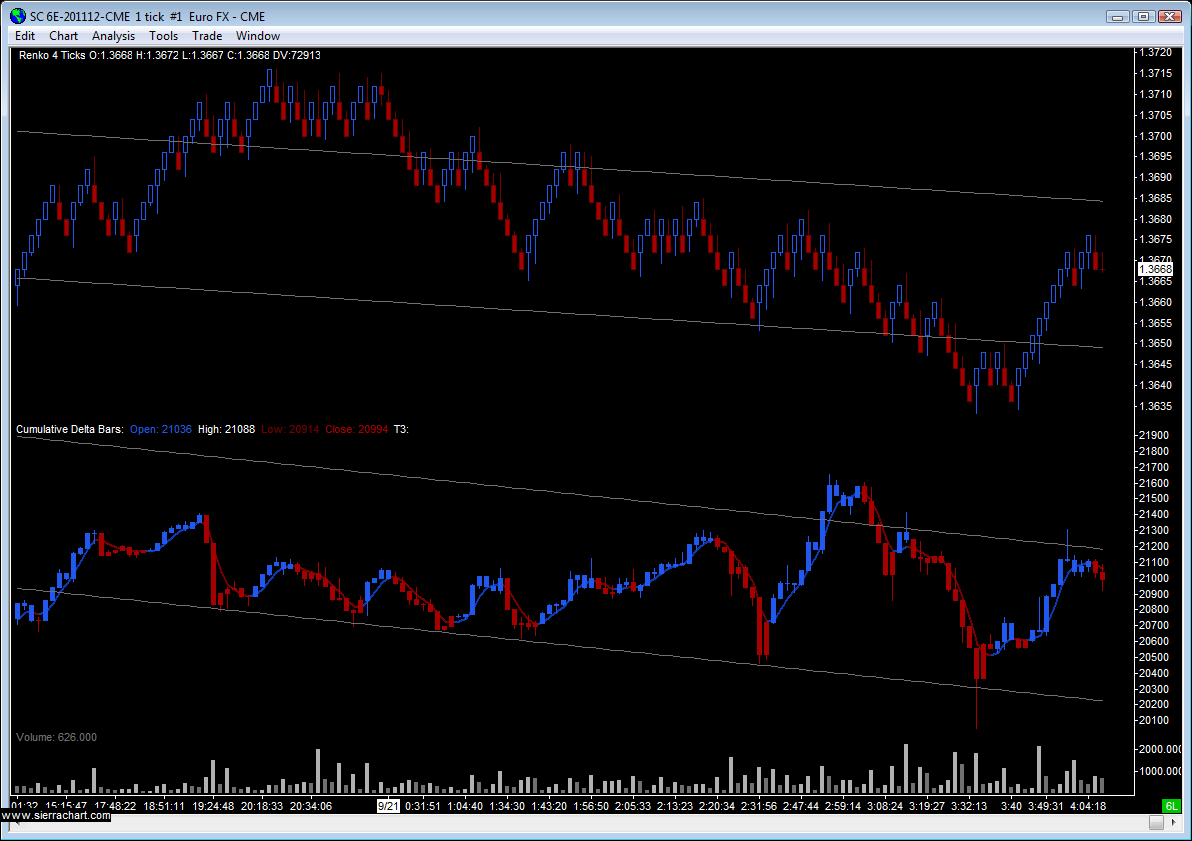
Looks like a stop hunt, now maybe we get some more sellers. I'd like to see us retest '35 and then move thru it this time. If we can't move thru it, I think I am gonna call it a day and just close out remaining positions until tomorrow.
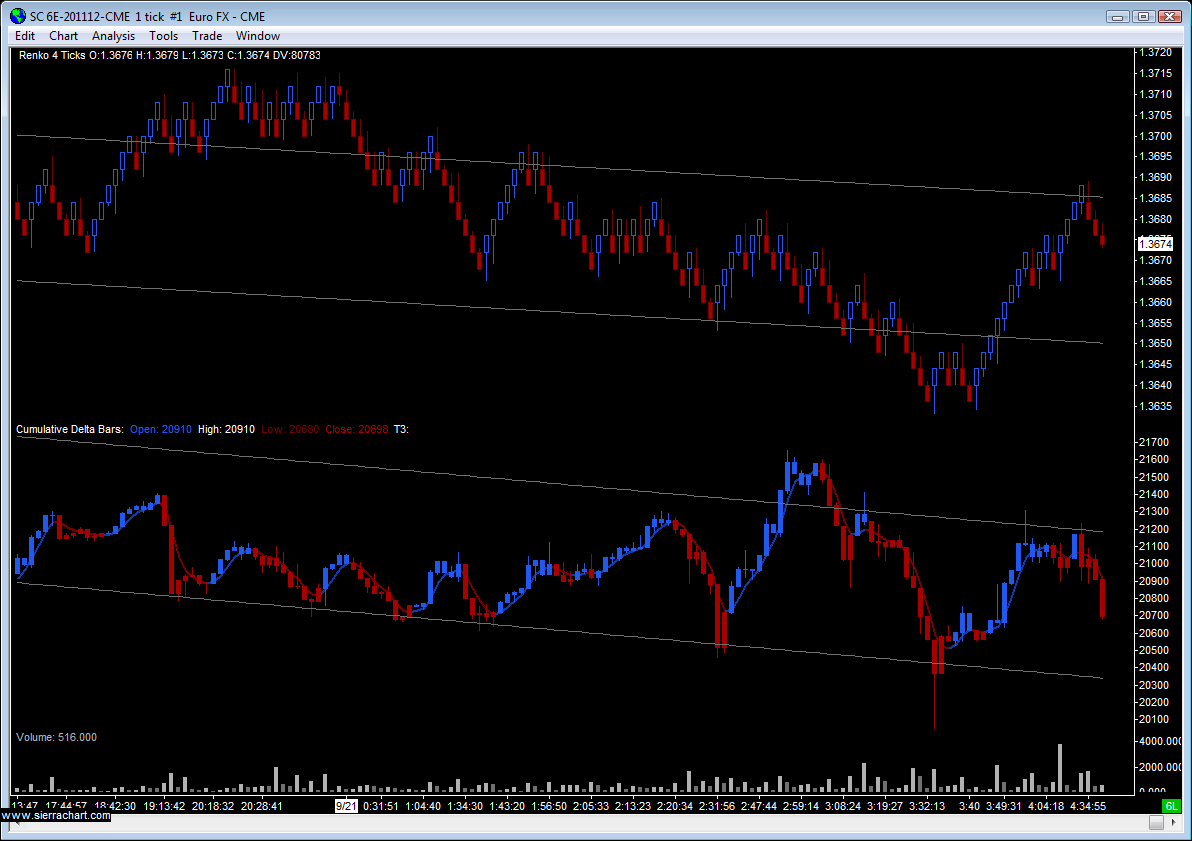
Well I didn't want this thread to be about delta. But since I am the main guy posting in the thread right now, and my charts have delta on them, and I am using delta...
It's simple. Look at the delta difference between swing highs and lows. Call it divergence, whatever, but really what we want to measure is the difference from swing to swing. The size of the swing will depend on your trading style. I also pay attention to "bursts" of delta at certain price points, where I can envision trapped traders getting hit with stops. This is usually a good place to add to a position.
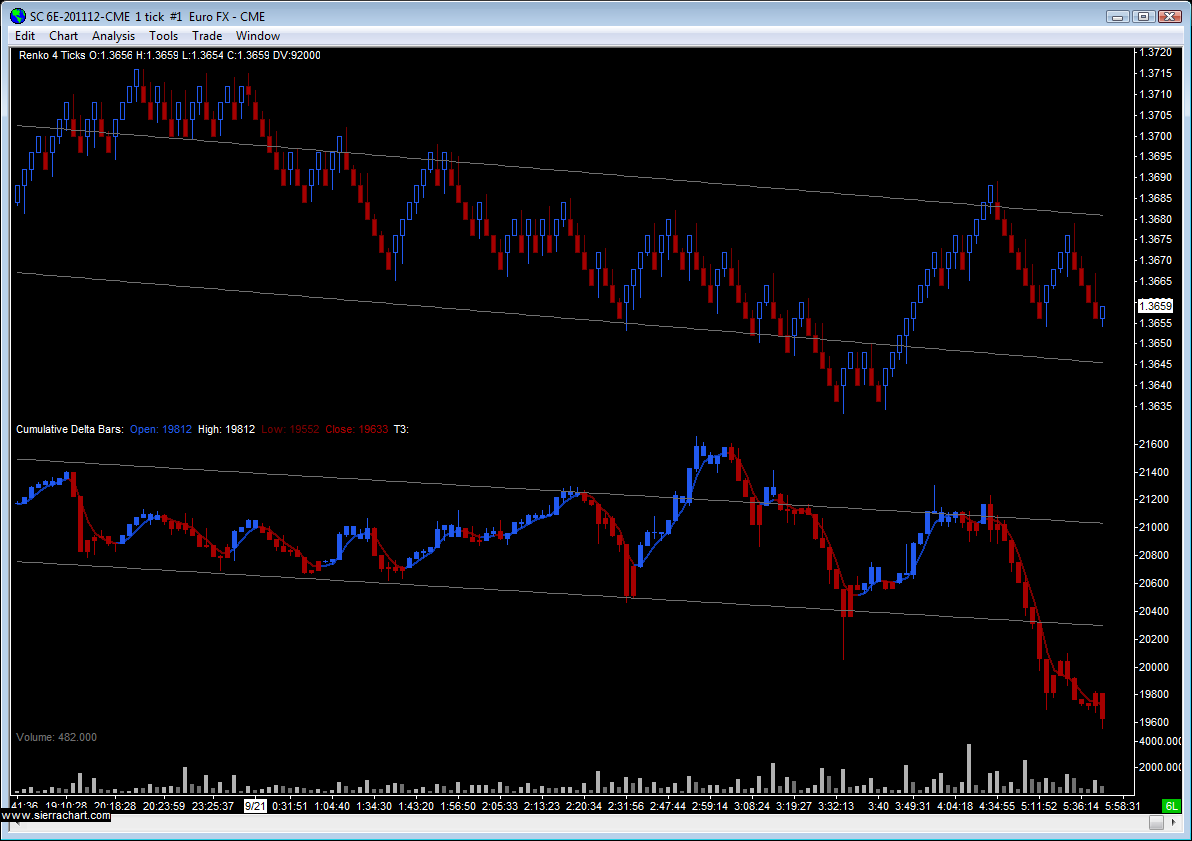
Today however I'm just trying to unwind a short position. I don't want to trade into FOMC. Market is very sideways and not giving me much volatility to get out of my short. Maybe I should go to bed, and then the market will move for everyone.
I am no expert in CDV, but as I learn more about it I wanted to start a thread to discuss trade ideas. If you see me making mistakes in my analysis, by all means let me know.
Some basics:
CDV = Cumulative Delta Volume
Cumulative meaning growing or …
I am by no means an expert. But I am learning. It was a rough road at first, mainly up to the point where I learned MultiCharts was incorrectly plotting what I thought was valid delta. After I figured that out, it started to make more sense! NinjaTrader, Sierra Chart, and Investor/RT can all plot cumulative delta.