Welcome to NexusFi: the best trading community on the planet, with over 150,000 members Sign Up Now for Free
Genuine reviews from real traders, not fake reviews from stealth vendors
Quality education from leading professional traders
We are a friendly, helpful, and positive community
We do not tolerate rude behavior, trolling, or vendors advertising in posts
We are here to help, just let us know what you need
You'll need to register in order to view the content of the threads and start contributing to our community. It's free for basic access, or support us by becoming an Elite Member -- see if you qualify for a discount below.
-- Big Mike, Site Administrator
(If you already have an account, login at the top of the page)
My work here is done. Thanks for playing Good night.
I hope everyone made their goal. Trading FOMC is not ideal. I will not trade again until after FOMC. I hope you guys will post some charts and share some trades and strategy.
Relatively small trade, I was only looking for a 2 std Deviation retracement.
Idea is that we had a quick move down that moved into the +3std Deviation range on the big time frame I'm monitoring.
Coupled with a Break of an OS line(red Line) on the smaller chart with a divergence on a momo-indie, looked to get in right at the lows allowing me to remove risk quickly...... on my big time-frame chart, expecting at minimum a 2std move off those lows which hasn't happened yet.
At any rate, I've removed risk from the trade + a few tics or two. I get a lot of the BEs, and some that move nicely.
Got two nice winners as well to the left on those OS lines prior to this one.
Thanks Forrest for sharing your charts. I'll hope you post some more!
Here are my current charts. I should be asleep, but am not....
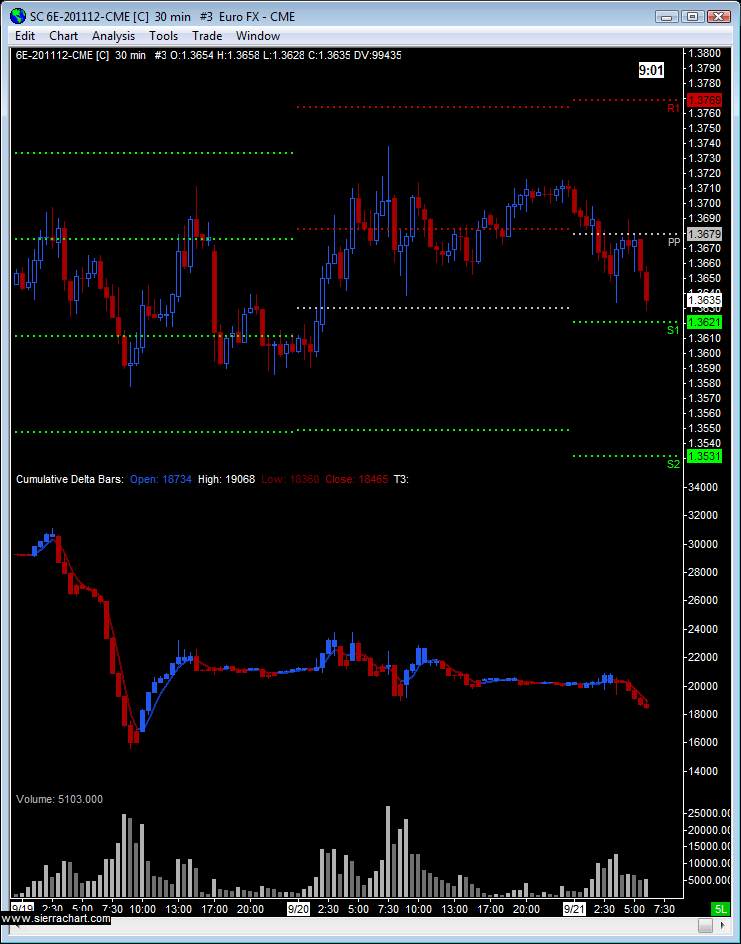
Top is the 30m which to me shows a pretty solid down trend today, but in the overall context of last 2-3 days we are very sideways. I was still short from yesterday and just looking to get out of my shorts today ahead of FOMC.
On the 30m chart you can see it move between the pivots pretty well. I tend to use pivots as targets.
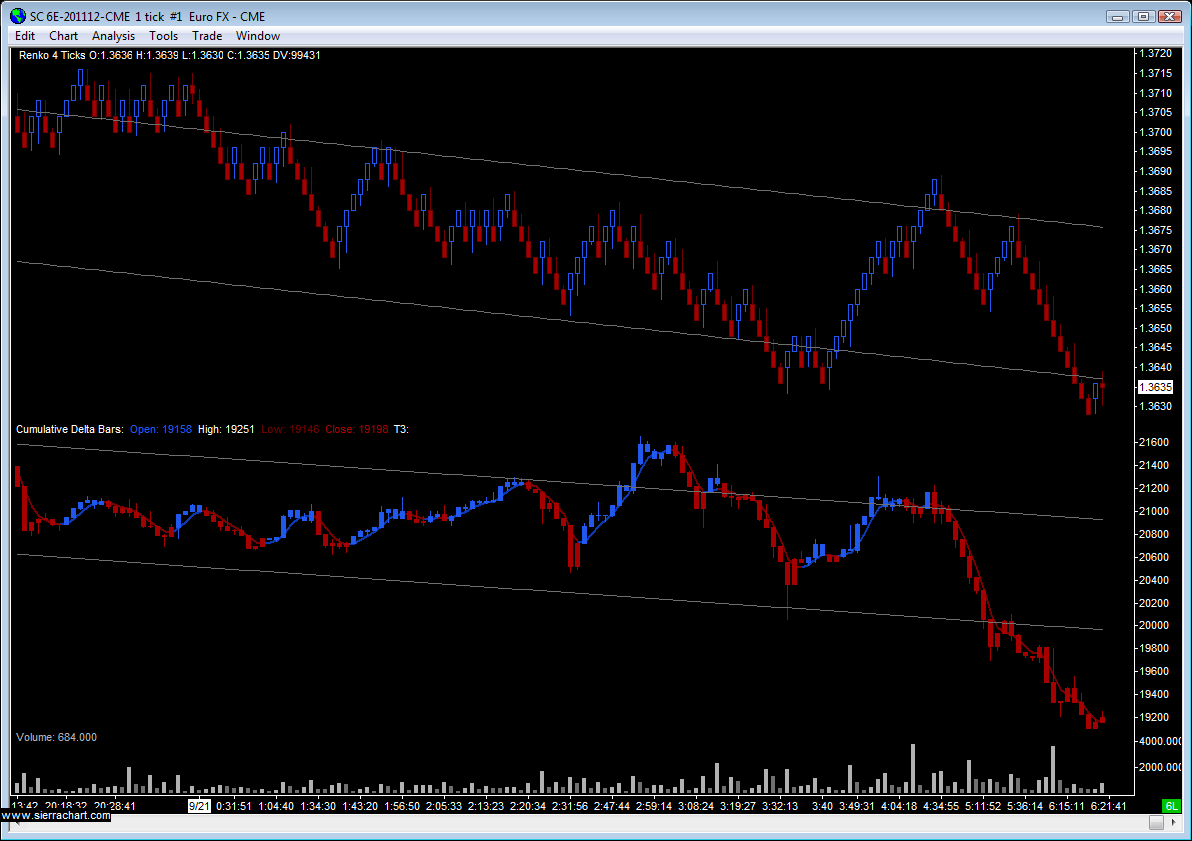
Second chart is my 4 Renko chart, which also shows the down trend. That is just a simple regression channel, nothing fancy. But you can see the cumulative delta in panel 2 has continued to make lower highs and lower lows all morning, for the most part.
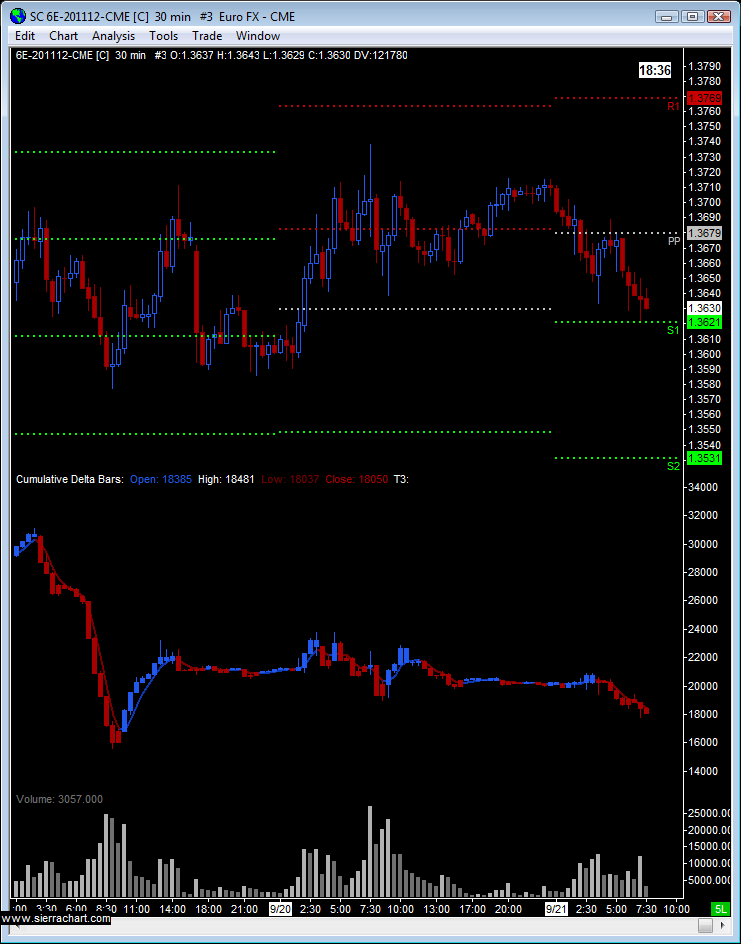
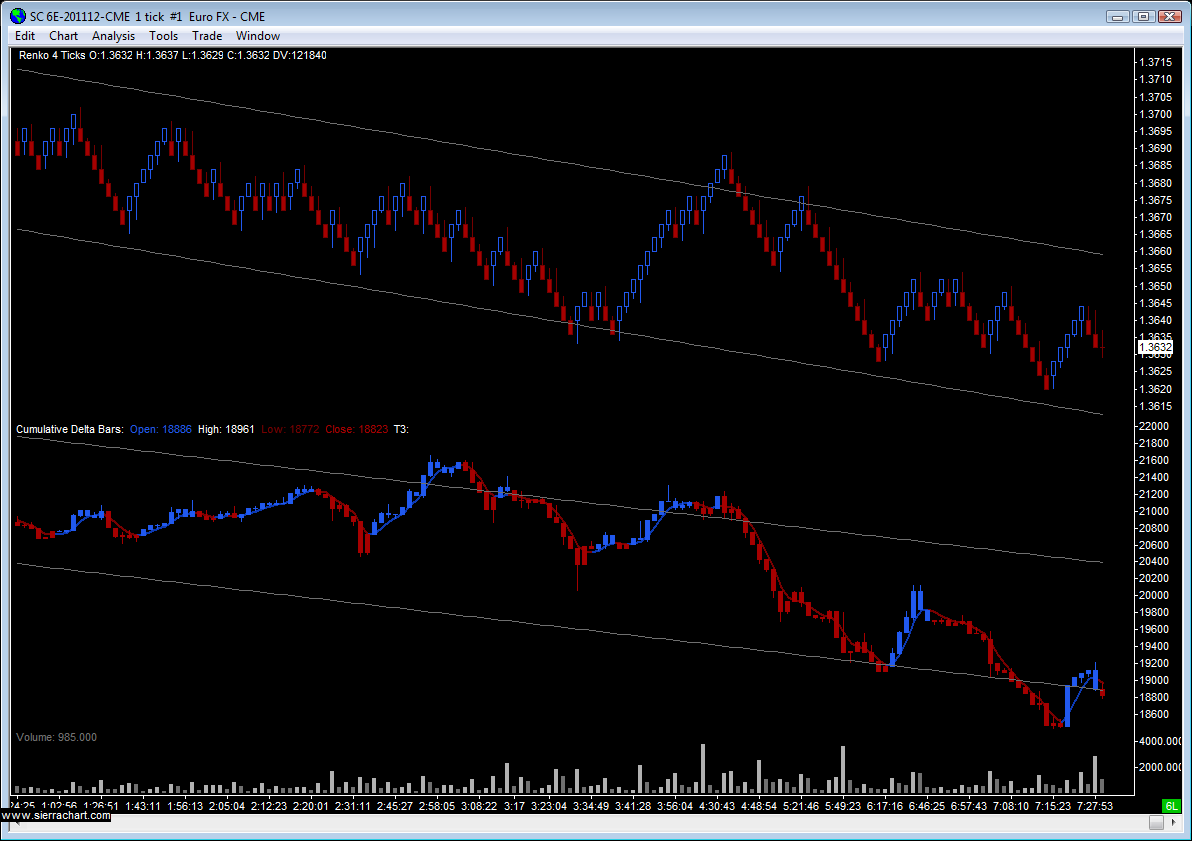
The last two charts are my MultiCharts charts, which show the Cumulative Delta Up/Down Tick in panel 2. The Sierra Chart panel 2 is Cumulative Delta Volume. I'd like to get SC to plot UpDownTick, but it doesn't yet. Or I'd like to get MultiCharts to plot Volume correctly, but it doesn't yet. LOL. So I use both. Anyway, on these charts you can see the unfilled gap which does act as a bit of a magnet, so to be watched especially if after the FOMC announcement we see a volatility spike. The bottom chart panel 3 is just a basic MACD, nothing complex (using diff).
Does this work well for you? I tried it for a long while. The old saying "you can't go broke taking a profit". But I couldn't make it work. Losers were full sized, and breaking even on too many trades didn't help. I guess the biggest issue for me is I would exit break even, then ask myself "should I still be in this trade?", or maybe the better question "is there any reason to not be in this trade?". The answer was that I should still be in. Moving to break even made no sense.
But you need to find what works for you. That is what is important. You can't copy someone else. And you've got to play to your own strengths.
I have noticed that in the "forex world", if you can call it that, a larger number of people seem to advocate setting their stop loss to breakeven and then letting the position "ride". That just doesn't work for me.
EDIT: While I was typing, your initial target of 60 was hit, but you got out breakeven.... ouch!
I'm sure you and everyone else knows, it has its good and bad, so just MY thoughts. For a while I've been focusing on really precise entries with relatively small hard stops, ~10 pips on the EU.
The GOOD is that it's really easy to remove risk right away. It makes it easier and less stressful to pick a place to exit and remove that risk because the entry is so good. The R:R is easier to control. The best benefit though, is that when I am right, I am usually SPOT-ON, in that I usually am able to grab almost the bottom/top tic of any intermediate move I am trading.
The BAD has it's "Trade-Offs" of course. Most noticeably is that when I am wrong, and I am still wrong often, I am usually taken out of the trade immediately. And am stopped on WAY more often than I was when waiting for confirmation. It can be mentally frustrating to watch 2-3 of these occur on one day, that is still a bitch.
So, I guess it's just a matter of.... picking your poison?!?!
Btw, I took 3 tics on that. Woot!
-----EDIT-----
About trade-offs..... you cant get something for nothing. For car enthusiasts.... if you had an older 87-93 mustang and stuck say an E-303 cam in it, it will run better, but your idle will go to $hit.
I am still awake, replying to a bunch of PM's and emails for the site.
I see the Euro just tested overnight highs, and looks like a rejection so far but it's early. If we end up coming all the way back down into the 70's then I would call that a rejection for sure.
Is that MTPredictor on your charts? Also, do you have emini-watch indicators, or is that something else that provides the PB and End of trend indication?


 Good night.