Welcome to NexusFi: the best trading community on the planet, with over 150,000 members Sign Up Now for Free
Genuine reviews from real traders, not fake reviews from stealth vendors
Quality education from leading professional traders
We are a friendly, helpful, and positive community
We do not tolerate rude behavior, trolling, or vendors advertising in posts
We are here to help, just let us know what you need
You'll need to register in order to view the content of the threads and start contributing to our community. It's free for basic access, or support us by becoming an Elite Member -- see if you qualify for a discount below.
-- Big Mike, Site Administrator
(If you already have an account, login at the top of the page)
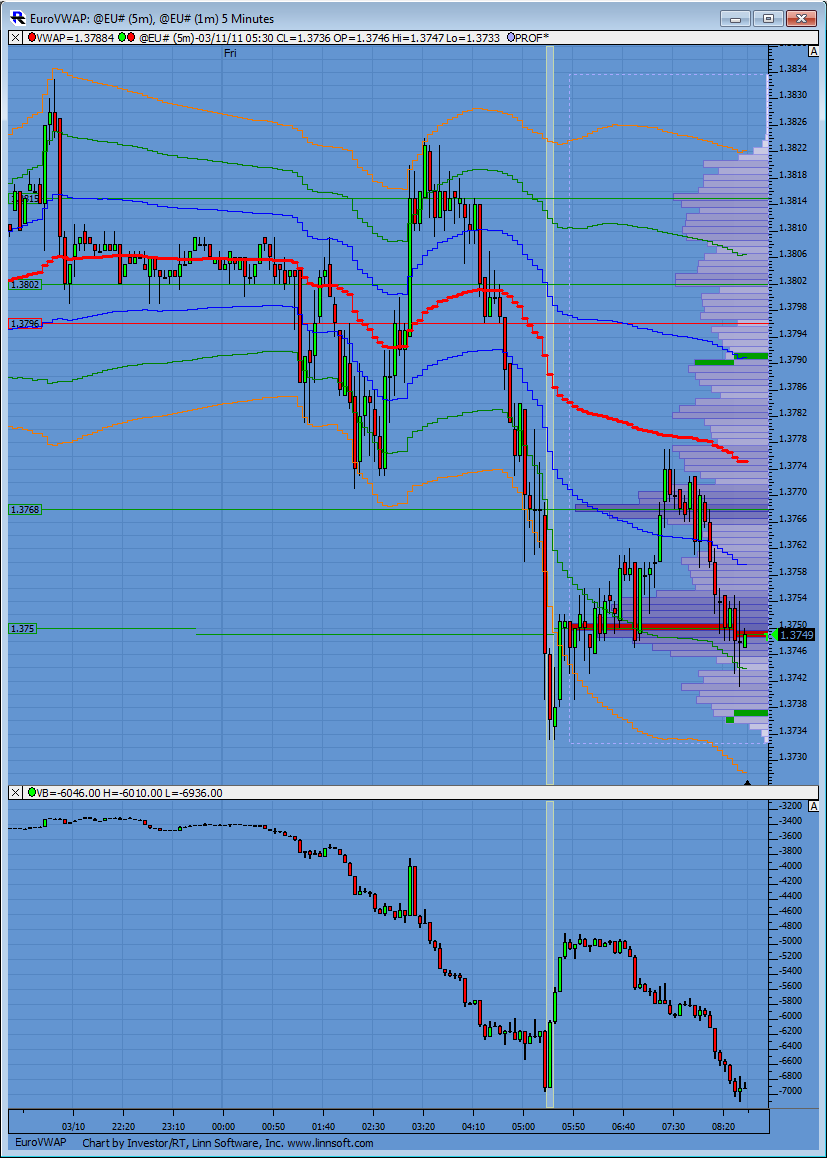
a friend of mine was showing me Marketdelta and its features, when he plotted VWAP indicator , i've seen something seems me wrong.
when price makes a big movement, the bands don't widen as result by the price movements but they tend to follow the price .
this is the same either the price goes up or go down.
I can see that the bands widen after a sharp price movement as they should. Of course, the bands also follow price, as they are bands around the VWAP, and the VWAP follows price, as it is an average price.
Here you can see how have to work bands (right pic is Ninja trader 7) and how work in MD.
Lows bands can't follow the trend when a sharp price movement occurs.
There is certainly no way how bands have to work. It really depends on the definition of the bands. I have an idea, what may have caused the difference.
The bands are calculated by starting with the VWAP and then adding and subtracting multiples of the standard deviation. The VWAP only depends on the exact session chosen, so there is not much room for discussion. It may lack precision, if the resolution of the bars is insufficient, but it will certainly be close to identical for all charting software packages, if you apply it to a 1 min chart.
The difference comes from the standard deviation
So the problem comes with the standard deviation. There are different ways to define it. Let us first have a look at the Bollinger Bands with a period N. The standard deviation is calculated in the following way:
-> Calculate moving average as sum of last N closes divided by N
-> Calculate the squares of the difference between the n close and the last value of the moving average
-> Add up the square to calculate the variance
-> The square root of the variance is the standard deviation
-> Add and subtract a multiple of the standard deviation to the moving average
This is pretty straight forward. For the Bollinger bands the period of the standard deviation remains constant, so you can compare the standard deviation of yesterday at 10:00 AM to the standard deviation today at 3:00 PM.
The VWAP is an entirely different animal. It is a moving average with an ever increasing period until the session closes. If you calculate the standard deviation in a similar fashion as for the Bollinger Bands, you will start with a small period standard deviation and then have a standard deviation with a large period at the end of the session. Any bands calculated in the same way as the Bollinger Bands are therefore of little use. I can imagine different ways to calculate a standard deviation which is more in line with the requirement to get meaningfull bands.
Standard deviation is a measure of dispersion as is the average true range, and in a first approximation I would assume that the (average) value of the standard deviation increases with the square root of the period N. So one option would be to calculate the standard deviation in the same way as it is calculated for the Bollinger Bands, taking into account the ever increasing period and converting it to a fixed period standard deviation.
Different ways to calculate standard deviation
Another way to cope with the problem would be to calculate a standard deviation from differences of the closes and the value of the VWAP corresponding to that close. See the difference:
-> for a Bollinger Band you take n different closes and subtract each of them the last value of the moving average
-> for the standard deviation of the VWAP bands you could take n different closes and substract each of them from the corresponding of the last n values of the VWAP, meaning you take a different value for the moving average each time
Applying the second method will get you the standard deviation of the average distance of price from the VWAP.
How have different software packages implemented the bands?
To summarize, there can be at least 3 different methods to calculate standard deviation bands for the VWAP. What we have to find out now, is how the different software packages calculate those bands, and which of the options is most suited to trading.
I had a look at the NinjaTrader VWAP. It comes with two different options to calculate the standard deviation, one of them is called VWAP, the other one AvgVWAP.
The VWAP mode is comparable to a Bollinger Band with an increased period. Of course, if the volume of a bar takes the value k, the period is increased by k, and the values are stored in an array. The standard deviation is then calculated by using the last value of the VWAP as an input for the variance. So this is a non-corrected version.
If there is a sudden move of price with high volume, this drags the VWAP aways from its prior balance, which means that the variance of all data points that had already been collected increases as well. And as there are no dropouts at the beginning of the period, as would be the case for Bollinger Bands with its moving average, the variance of the old data points increases.
I am not sure that this makes sense, but it is the outcome that @beowulfit showed on his chart.
The other option with an average price of the VWAP is quite a peculiar approach. It is not a standard deviation of price relative to an average, but a standard deviation of the VWAP relative to its average price (the average of all VWAPs). I don't see any point in calculating this and won't further comment it.
The two different approaches can be seen on the charts below. Neither calcualtion method for the bands is identical with the solution adopted by Inverstor RT or Ensign Windows.
Investor RT has different options to plot the bands. Some of the options use my suggestions from post #6.
Option 1: Use the variance of the difference (close - average) by using the average at the time of the close.
Option 2: Use a quarter of the session range up to that point
Option 3: Use the average bar range of the last 20 bars (this is more like a Keltner Channel thing applied to VWAP)
etc.
Options 1 and 2 will give you bands that expand over the lifetime of the session. This is unlike Bollinger Bands, which expand and contract, but do not have a trend of continuous expansion.
Option 3 does not expand, but you could use the average true (using simple smoothing instead of exponential smoothing) over the session.
There are also proprietary ways of calculating bands, which are not disclosed.
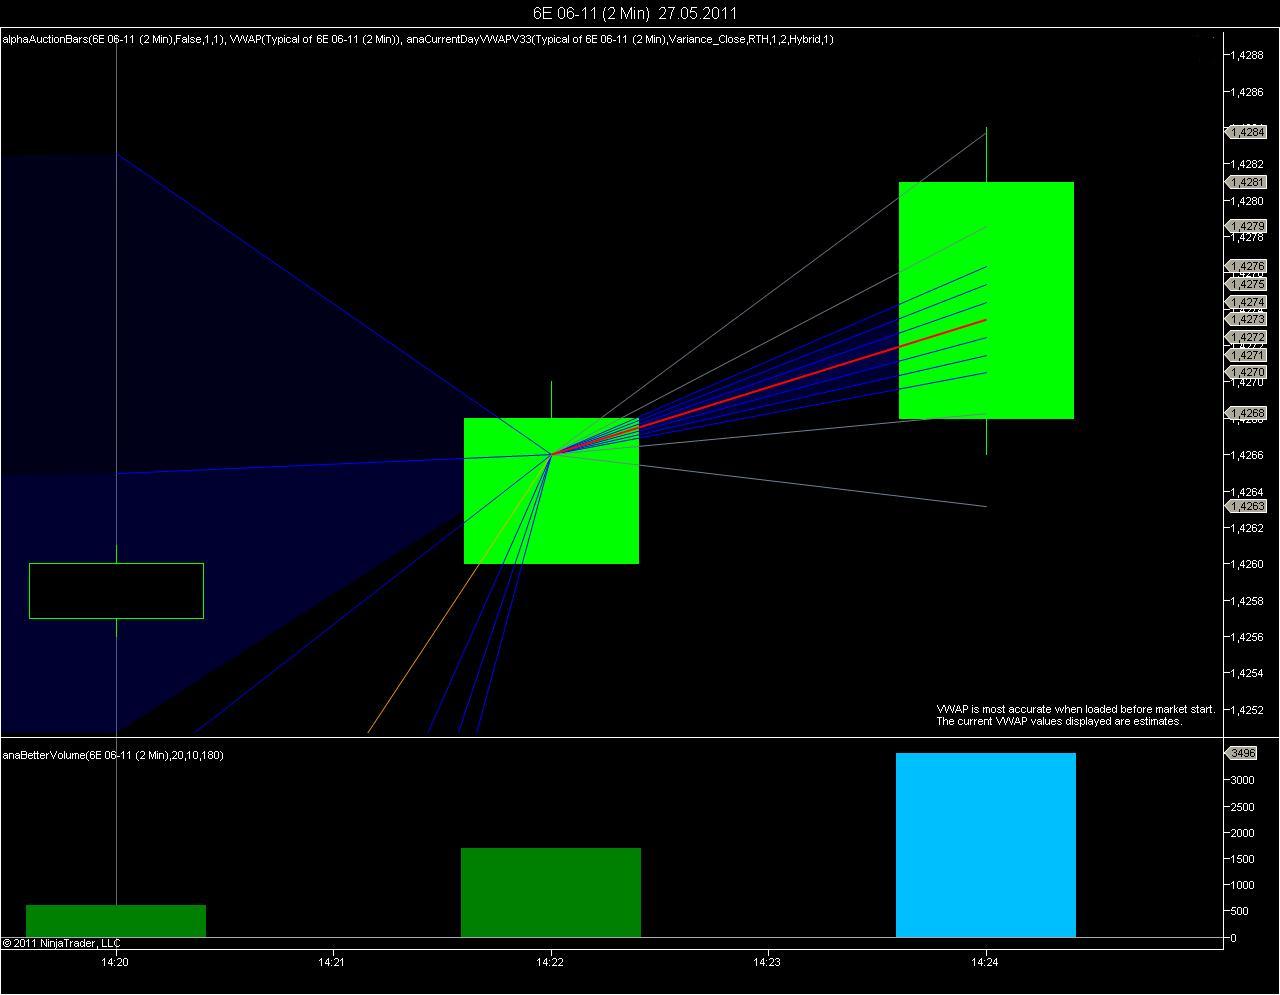
which seems to be identical with the VWAP in the download section of the NinjaTrader forum.
The chart below shows VWAP (red) and standard deviation bands as calculated by the NinjaTrader VWAP (blue bands) and an indicator that I have coded for testing (slate gray bands). After two bars into the session, it is easy to calculate the standard deviation manually:
This shows that the blue bands are too narrow and do not catch volatility correctly, the standard deviation after two bars is around 5 pis and not 1 pip as shown by the NinjaTrader VWAP indicator.