Welcome to NexusFi: the best trading community on the planet, with over 150,000 members Sign Up Now for Free
Genuine reviews from real traders, not fake reviews from stealth vendors
Quality education from leading professional traders
We are a friendly, helpful, and positive community
We do not tolerate rude behavior, trolling, or vendors advertising in posts
We are here to help, just let us know what you need
You'll need to register in order to view the content of the threads and start contributing to our community. It's free for basic access, or support us by becoming an Elite Member -- see if you qualify for a discount below.
-- Big Mike, Site Administrator
(If you already have an account, login at the top of the page)
Help wanted on Range Expansion prediction. New traders ideas welcome!
I wanted to add to my post. I also keep a notebook of manual calculations per contract, e.g. Dec, March, June and Sept. So I dug around and found the data I had for the trading day I posted above.
The anticipated range for the day was 81 ticks
The 2 week (10 day) average range was 82 ticks
The 4 week (20 day) average range was 82 ticks
The Buy Number for the session was 1.2710
The Pivot Number was 1.2748
The Sell Number was 1.2790
The "current" range at the London Open (3am est) was (+/-) 35 ticks
Armed with these numbers before the 3am Open I was expecting
1.) Normal price Rotation around the whole number of 1.2750
2.) The Pivot (1.2748) to support price (enforced by the option data)
3.) Extension of the range to be to the up side
4.) I was expecting the range to meet/match the historical averages,,, so by taking the LOW and adding the anticipated range, the "EOD High" should be 1.2802
This chart Nov 16 2012 cuts off the prior day's (Nov 15) high but the data in my notebook has the high for 11-15-12 at 1.2807. FWIW, these charts were captured for another purpose but I hope you find them helpful.
You highlighted 1.2750 (versus 1.270 or 1.280) in yellow.
1. Was this prices 2750 close to the midpoint of Nov 14th?
(I compute 2787-2706=81/2=40.5 => 2746.50 or approximately 1.2750 your highlighted price?)
On the 15 the low was 2721 and the high 2777?
You bought about 3:40am (2749 and 2747) so approximately 1.2750 your highlighted price.
Keep it simple. Most traders go to great lengths to over complicate things.
All I'm looking for is the sum total of all open option positions resting on S/R levels. I consider these open option positions like "re-bar" (steel reinforcing rod in concrete) running through the S/R levels I've already identified. I do not concern myself with percentages of puts vs calls, only the sum total. There's a lot of information buried in these numbers and I assure you you can spend countless hours slicing and dicing to your hearts desire. The fact is, these levels will give way eventually, I only expect them to support my position "a time or two" during a single trading session (rule of three). Remember, these OI numbers are for the "prior day," you have to look at the price action of "that day" to ascertain information as to why (maybe) the OI increased or decreased. To be absolutely clear, I don't take trades based on these numbers, per se, I only expect them to "reinforce" levels I've identified by other means. I have a thread that defines my method if you have an interest take a peek,
If you find the title of this journal intriguing, I invite you to stick around, participate and watch it unfold. I've read several of the threads on Big Mike's Forum and noticed that many members are …
Are you looking to predict the range expansion to try and determine the next days range?
Here's an idea you may want to expand on: When todays range is around 50 to 60 percent of the 10 day avg range...then you could logically assume it may "revert to the mean".
Now to possibly "predict" where price could go the next day...I've been using on a 5 minute chart moving average envelopes(charts at Interactive brokers.com) with the settings:
EMA 390...then upper and lower boundary settings at .25, .5, .75.( If using day session numbers only)
If you use the overnight numbers in your calculations then use EMA 780.( covers data from the start of the European session)
And thanks!
Yes this is very much what I was thinking of when I started the thread.
So the idea you are putting forward would be that when the range gets very narrow, it could possibly expand the next day and if so the envelope might give an idea of a target?
Here is my version of what you might be describing for an envelope (I only have one setting 0.75 but perhaps that is because I am running an older version of TWS? Rick does your envelope have different settings?
In brief I have struggled with this and do not yet have a good answer to your question.
I have noticed that contraction of range for a period of time can happen under certain conditions and one is the current situation where we broke to the ceiling of1593 we had been putting in place for some time. Until that was broken there were still baby bears, pushing it down from 1593 ceiling - three times I think. Then we pushed up through it with and amazing /ridiculous day jumpin 22 pts in the daily midpoint.
When we push up like that then the bulls will only edge it up and the bears are waiting and range drops from 15-16 to 8-9 area.
For today however there we some unusual conditions the o/n session (see trading thread summary
) was smaller than normal and the preopen session was outside the o/n. This indicated an unusual day and as you can tell I should have gone wider than 8.5 and to the 11-12 area.
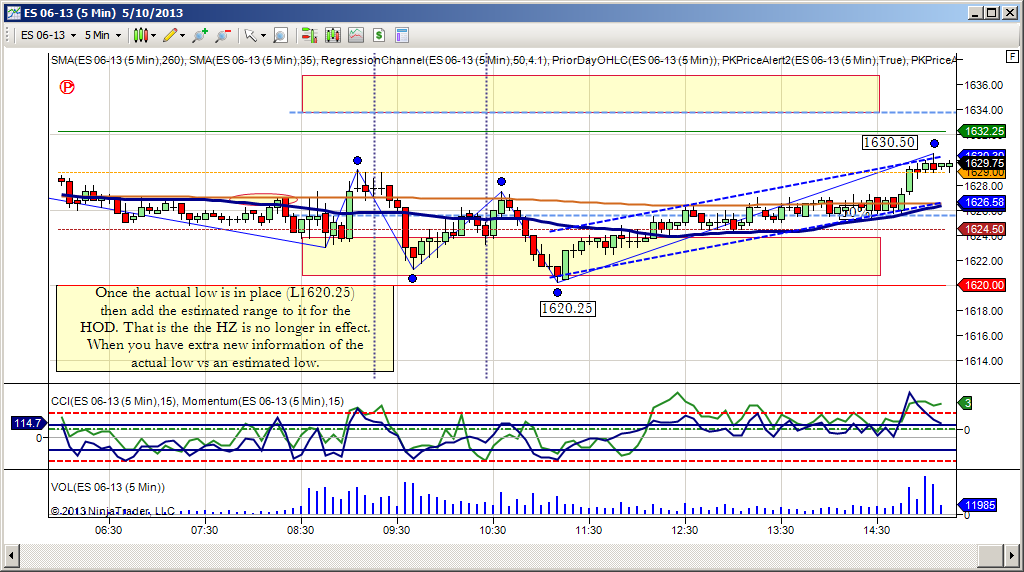
Todays shape was unusual a "nessie" day with and exanding range forming a wedge and then right at the end a double low at 1620. Should make for an interesting o/n session and perhaps some surprises on Friday - though Friday is usually a narrow day cabbage day.
This doesn't answer how to predict the range, but rather the use of the range info once you have it.
Once the actual low is in place (L1620.25) then add the estimated range to it for the HOD. I call this my "range rule". L1620.25+10=1630.25
Actual 1630.50