Welcome to NexusFi: the best trading community on the planet, with over 200,000 members Sign Up Now for Free
Genuine reviews from real traders, not fake reviews from stealth vendors
Quality education from leading professional traders
We are a friendly, helpful, and positive community
We do not tolerate rude behavior, trolling, or vendors advertising in posts
We are here to help, just let us know what you need
You'll need to register in order to view the content of the threads and start contributing to our community. It's free for basic access, or support us by becoming an Elite Member -- discounts are available after registering.
-- Big Mike, Site Administrator
(If you already have an account, login at the top of the page)
Hi I'm starting two threads on steps to get started using Sierra Charts Advanced Custom Study/System Interface and Language (ACSIL).
This thread I would like to keep just for examples and steps to producing your own Custom Studies and Trading systems in SC. And another thread for questions about the examples in this thread.
To start I recommend setting up MS Visual Studio to program in. You can write the C++ files in Notepad++ as a minimum and compile as per these directions from Sierra Chart but you will miss out on a lot of the programming tools, error reporting and auto filling that's available with a modern IDE.
So first steps download Visual Studio Community version, https://visualstudio.microsoft.com/downloads/
(Its a big and bloated download)
You need to check the "Desktop development with C++" tools to include with the download but if not you can add them after install by going,
Tools>Get Tools And Features.. and the select them like in this pic and follow the modify/downloads and install instructions.
Ok once MS VS is installed start it and select "Create a new project",
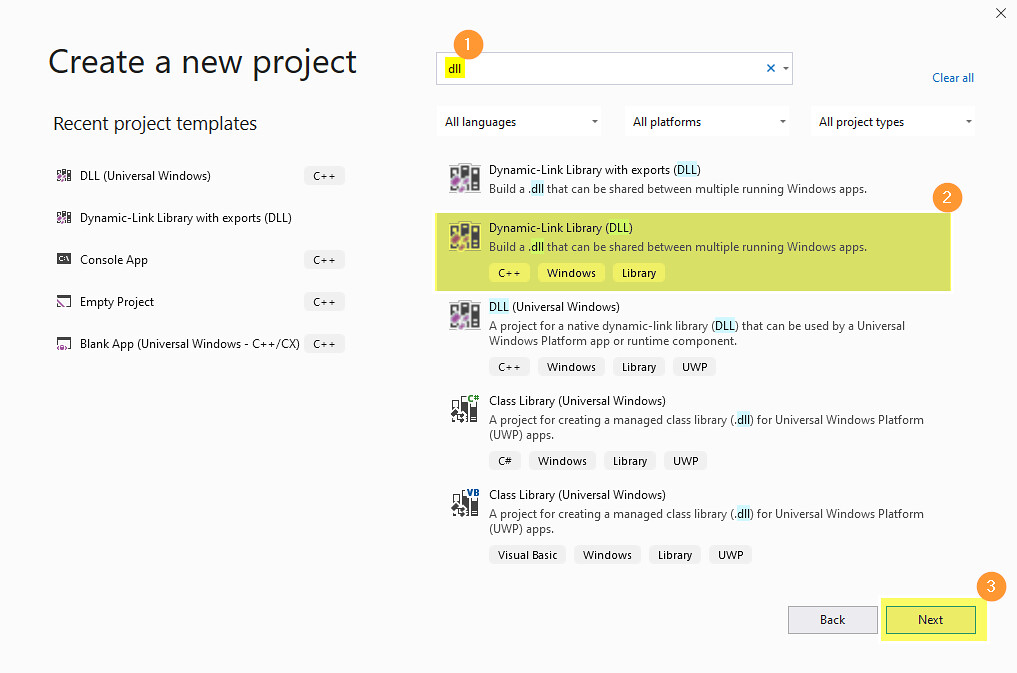
Step 1. Then in the search box type "dll"
Step 2. Select Dynamic-Link Library (DLL). Be careful to select the right one as there a few similar types.
Step 3. Hit "Next"
Next give the Project a name. "SC_ACSIL_Examples". Use the same as me to make it easy to follow the next steps .
And save the project to a folder that makes sense to you. (remember where)
Then hit "Create"
That will create a project with a heap of files and dependencies that you do not need so I delete everything but whats needed. As per the pic below hold down "Ctrl" key and select "framework.h","pch.h","SC_ACSIL_Examples.h","ddlmain.cpp',"pch.cpp","cpp.hint". Making sure NOT to delete the "SC_ACSIL_Examples.cpp" file. Thats the one we program in.
Then go Project>SC_ACSIL_Examples Properties.. then,
Step1. Make sure in the Configurations drop box you have All Configurations selected
Step 2. Put in "C:\SierraChart\Data\" or you corresponding SC Data folder in the output directory
Step 3. Make sure Configuration Type is Dynamic Library (.dll)
click apply
Then Go to
Step 1. C/C++ > General
Step 2. Under "Additional Include Directories"
Step 3 Add "C:\SierraChart\ACS_Source"
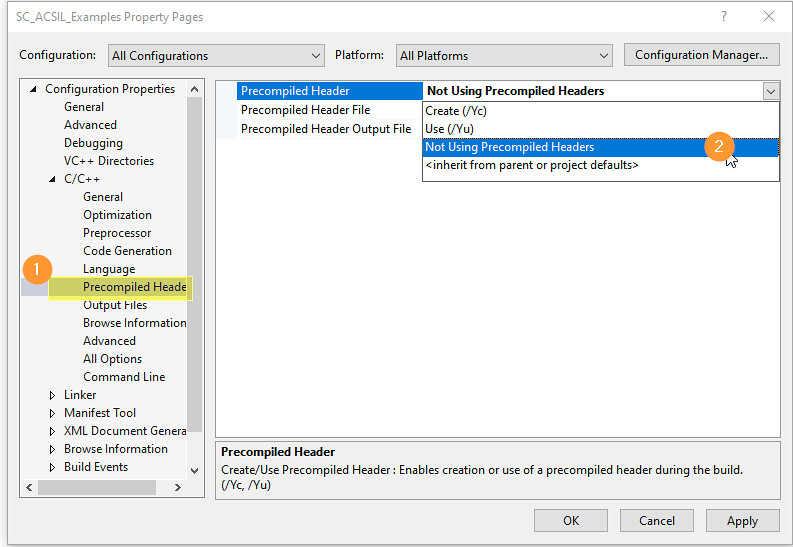
Finally go to C/C++ >"Precompiled Headers"
And select "Not Using Precompiled Headers"
Hit Apply and then OK And thats now setup to start programming.
Open the "SC_ACSIL_Examples.cpp" file in in the main window of MSVS. If you are lost go,
View>Solution Explorer>SC_ACSIL_Examples>Source Files> double click on "SC_ACSIL_Examples.cpp"
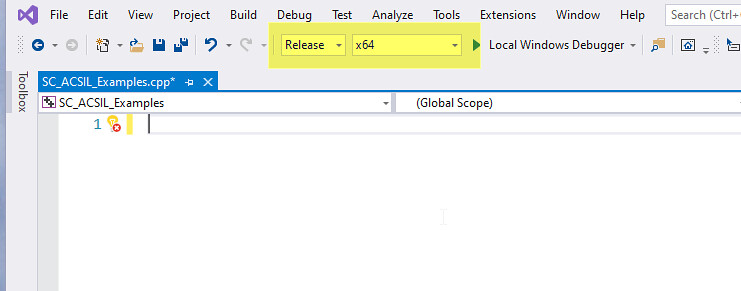
Make sure you have Release and x64 selected as per the pic. This is very important. This will make a 64 bit dll. If you make a 32 bit dll SC will not reckonise it (as SC is now 64 bit only).
Again make sure you have x64 selected as per step 1
Then at
SCDLLName("Custom Study DLL")
change it to
SCDLLName("SC_ACSIL_Examples")
to keep it the same as my for this example. When you start producing your own you can name it whatever makes sense.
Then another important step change,
SCSFExport scsf_FunctionName(SCStudyInterfaceRef sc) to
SCSFExport scsf_SC_ACSIL_ExamplesV1(SCStudyInterfaceRef sc)
Making sure you don't delete or leave off the scsf. That is the function tag that SC searches all .dll in the data folder to see if there are study functions for it to load. Without that leading scsf SC will not load anything from our dll.
Now time to build
Go Build>Build Solution
If you have done all these steps perfectly in the output window you will see it start doing stuff and then finish with
========== Build: 1 succeeded, 0 failed, 0 up-to-date, 0 skipped ========== and a .dll file will be saved to your C:\SierraChart\Data\ like this,
If you open Sierra Chart and go Chart >Studies>Add Custom Study
You will/should see our SC_ACSIL_Examples study listed. As it stands it's useless at the moment as it does nothing but we have a start!
Please post any questions and problems or suggestions you have in this thread about my Sierra Chart ACSIL for Beginners to keep that thread reasonably concise and clean of tangents.
I'll come back tomorrow and start the actual programming part but as it stands up to this point if you have followed along correctly you will have a .dll in SC Data folder which is the complided study file with a few other files and a project folder that you created at the start somewhere probably in you Docs with the SC_ACSIL_Examples.cpp file and Microsoft Visual Studio project files. SC doesn't use these project or .cpp files only the .dll one you have built the project.
Ok so as it stands we have a framework for building any Sierra Chart study in this code we compile in MSVS.
The very first line of code always is
This brings into our study all the Sierra Chart structure as well as the Windows C++ Standard Library that we will be programming with. At the moment we don't really need to worry about that and just move on to the basics of ACSIL.
In the standard ACSIL Template Code there are three sections that different things are done in.
1. You declare any sc.Subgraph[] and sc.Input[].
sc.Subgraph[] are the arrays which will hold your study calculation and display them on your chart.
sc.Input[] are Inputs allowing user-specified inputs or parameters to a study function. Think for example a period setting for a moving average, like '20' for a 20 period or a Yes/No for a "Use even session Data" in your study.
2. Is where you set default setting for your studies Subgraph and Inputs.
These are the setting you see in the "Settings and inputs" & "Subgraphs" tabs when you open the "Study Settings" dialog box.
Like does a Subgraph display as a line or bar, what color is it etc.
Also in this section you set important study defaults like how it deals with data (Auto looping or manual), what Chart region is is set to etc.
3. Is where you do the actual programming to make calculations.
To start we will jump straight into accessing and display some data into the log and plotting a basic Subgraph. When writing studies its very helpful to have values you are accessing and calculation being printed to the log for de-bugging purposes.
First step in our ACSIL template is to declare a Subgraph to work with and a sc.Input
Just below the
Add,
Its important in C++ that every line of code is ended in a ";". That tells the compiler that its the end of that line of code so don't forget them.
Then on to the Study defaults. There are a few default settings that have to be set in every study.
Firstly you should set a study name and description and set whether or not the study uses Automatic looping or manual.[/URL] link( Don't worry about the details of that yet we'll come back to it) but just know its easier doing Automatic looping.
For now this is all you need to know,
" When your study function uses automatic looping, then it is automaticaly called once for every bar or column in the chart when the study is initially calculated. If there are 100 bars in the chart, then it will be called 100 times when your study is initially calculated. After that, the study function is called as the latest bar is updated and new bars are added. " https://www.sierrachart.com/index.php?page=doc/ACS_ArraysAndLooping.html
So In the sc.Setdefaults block we add,
As you can see there is a leading sc. to many lines of code. This is the ACSIL Interface Members Structure which comes from sierrachart.h that you included in the first line of code.
It's located in C:\SierraChart\ACS_Source folder and that why at the very start in the project properties you set that as an "include directory" so the compiler could find all the sc functions.
if you type sc. anywhere in the SCSFExport function block you will get a auto complete box with all the Sierra Chart ACSIL members and functions.
Above we declared a SCSubgraphRef (Which means Sierra Chart Subgraph Reference) "BarRange" and assigned it to sc.Subgraph[0]
Now we will set some display defaults for that,
Every Subgraph that you want to plot in your Study must have at a minimum .Name = "Some Name" otherwise it will not show up in Subgraph windows or on the chart.
Again if you type BarRange. an autofil box will popup and show you all the default setting you can set.
Here is the full list, https://www.sierrachart.com/index.php?page=doc/ACSIL_Members_scSubgraph.html
For now we will set the Drawstyle to DRAWSTYLE_BAR ( See more here) and the color to Blue. See examples here.
Now set the BarRangeMultiplier input defaults,
Again it needs a .Name so we will put
and we need to set a type and default value. This requires some forethought to make sure you are setting the right data type ie, int, float, Boolean, Date etc
You can see what you can set it to here, but we will set it to an Integer and give it a default value of 2
Its important that you have that
as the last line in the sc.SetDefaults Block or SC will crash when you try to add it to a chart.
So Now your full code should look like this,
And the complete code so far,
To check that so far you are on track. Make sure SC is closed. Go Build>Build Solution and in the output window of MSVS you sould see,
And then open sierra Chart and on a chart go Studies>Add Custom Study and select SC_ACSIL_ExamplesV1 and add to chart ad see if all is well.
To understand how to use chart data you have to understand how Bar data corresponds to arrays and indexing.
An array is a container object that holds a fixed number of values of a single type. Each value can be accessed by an index. The main arrays in SC are sc.BaseData[][] arrays contain the data for the main price graph in the chart. The sc.BaseData[][] arrays are used as input data to your study.
For example Close prices of each bar are stored in sc.BaseData[SC_LAST] or sc.Close[] (two names for the same thing). A few others are,
sc.BaseData[SC_OPEN] or sc.Open[]: The array of opening prices for each bar.
sc.BaseData[SC_HIGH] or sc.High[]: The array of high prices for each bar.
sc.BaseData[SC_LOW] or sc.Low[]: The array of low prices for each bar.
sc.BaseData[SC_VOLUME] or sc.Volume[]
Others are are listed here.
There are two other types of arrays in SC. You have already seen sc.Subgraph which you use to hold you study calculations and display data in. The other type of array available is sc.Subgraph[].Arrays[][] which are extra arrays available for extra study calculations and storing non-display data which we won't be using for now.
All these arrays store data as floats.
The only exception to that is sc.BaseDateTimeIn[] and sc.DateTimeOut[]
They are the starting and ending DateTime for each bar and are stored as SCDateTime data type which is a C++ double.
Now after all of that how do you use them? Well to access a value in an array you use the index (think Bar number). The indexes start at 0 for the first bar, the left most bar in the chart, and increment by 1 for each new bar.
So if you have a chart with 20 bars and want the Close price for the last bar, the twentieth, you would use the Close array index 19,
Rembering that the first bar index is 0 the second bar index is 1 and the third bar index is 2 up to the last bar being Index = (Number of bars - 1)
If you wanted the second last bars volume and had 20 bars you would so,
Now to make things easier Sierra Chart has an inbuilt function that makes it easier to access the Index of the array with Auto looping which we set in the sc.SetDefaults with this line sc.AutoLoop = 1; It enables us to return the last Index of the chart. Its sc.Index
So the above two lines of code become
Easiest way to visualize it is to imagine each array as a column in a spread sheet. As you can see instead of having to calculate how many bars are in the Chart you just use sc.Index as the last bar Index, sc.Index -1 as second last, sc.Index -2 as third last etc
To populate our Subgraph with our calculation which we want to do as bar range the code would be,
When your study function uses automatic looping, then it is automatically called once for every bar or column in the chart when the study is initially calculated. If there are 100 bars in the chart, then it will be called 100 times when your study is initially calculated. After that, the study function is called as the latest bar is updated and new bars are added.
So for each bar this code takes the High of that bar - the Low of the Bar and populates that into the correspond Index of the our SubGraph. Then resets sc.Index to the Index of the next Bar and so on till its at the last bar. Whenever a new bar is added sc.Index is incremented 1 bar Index.
To finish off this first example we are going to add some data to the log as a way of showing how to track values in your programming and use our as yet unused BarRangeMultiplier input. Which is very helpful when trying to figure out whats happening and what values to use.
From the link above you can see the that this is a sc. function and it takes the parameters of an SCString as the message you want printed and an int of either 0 or 1 to control how the log will activate.
So we have to declare an empty SCString then use another sc. function to Format that string with what we want to print to the log.
The way we do it is like this,
Which is fine but useless! We need to add some data from our Study. To do that we use string place holders. Such as %d for an int, %f for a float and %s for another string. In practice if we want to add the Bar index an int, Bar High a float, Bar low a float and Our calculated BarRange a float, it would look like this,
As you can see we have a line of text in the " " and various % place holders within that test where we want to put our data.
Then after our text we have the variables which we want to place in that text message. They will be placed in the same order as the % place holders. If you try and put a data type that not in the right type of place holder, for example a Float in an Int place holder, you will get weird numbers showing up and it wont make sense so be sure the data type matches the % type.
We haven't used our BarRangeMultiplier Input yet. we have set a valye to it in the defaults sections with the .SetInt() function and to use any Input you use the .GetInt() function. As you can see in the SC Docs here there are a whole lot of differant .Set() and .Get functions depending again on the data type you are using.
So just as a silly example as to how to use sc.Inputs lets just create another variable and add it to our above string that times our BarRange by our BarRangeMultiplier.
To do that we declare a new variable that will be a float, because we are multiply a float and int which will make a float. Then do the calculation.
Then to add that into our existing String we use another sc function .AppendFormat() which will add new text to the end of an excising.
Then fiinaly use that SCString in the sc.AddMessageToLog()


 in the output window you will see it start doing stuff and then finish with


