NexusFi: Find Your Edge


Home Menu


Bid-Ask Percent Pendulum to verify Bottoms?


Discussion in Traders Hideout

Updated
    1. trending_up 1,308 views
    2. thumb_up 2 thanks given
    3. group 4 followers
    1. forum 1 posts
    2. attach_file 4 attachments


Search this Thread
  #1 (permalink)
 Regis767 
Palmdale, California
 
Experience: Intermediate
Platform: Amp Futures
Trading: Futures
Posts: 12 since Oct 2021
Thanks Given: 20
Thanks Received: 15

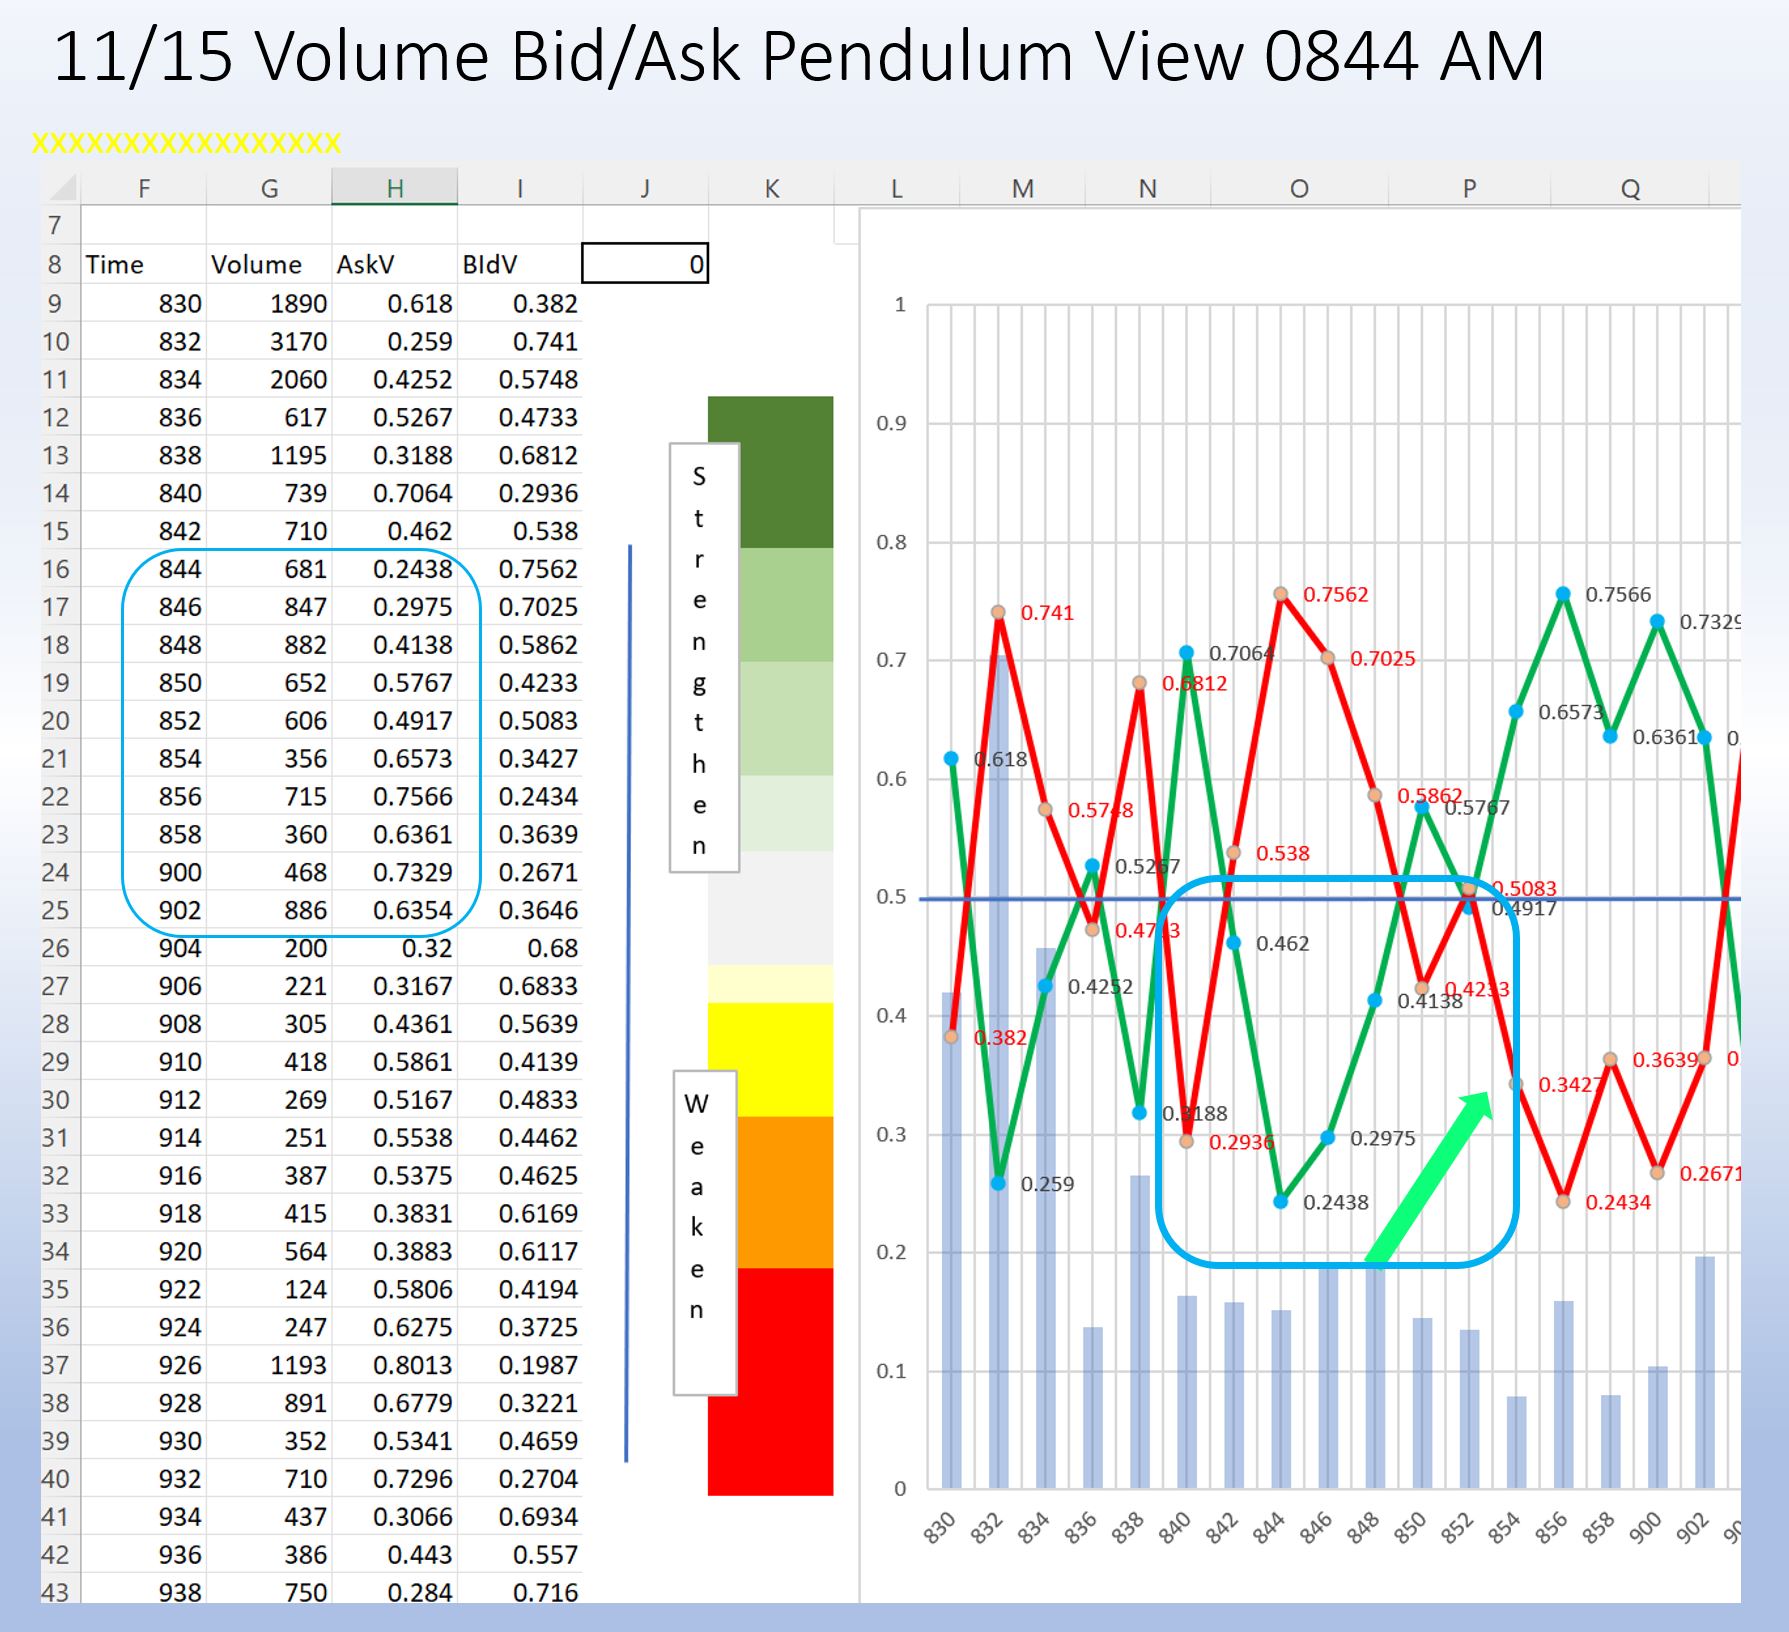
I developed a technique to watch swings in the Bid vs Ask Percentages and see if there was some kind of pendulum move, where if it went too far one way, it would swing the other way or at least signal a reversal was going to happen. It was tough to visualize, but I created an Excel Chart that would better show the swings between the Buyers and the Sellers.

I split this in the middle at a 50% line. Above the 50% is a strengthening, below is weakening. But what was more interesting was the actual Bottoming out of the trend. When either the Buy or Sell Trend bottomed out and then started to strengthen it gave a possible verification that the trend would continue.

Here are two examples from today, trading CBOT Corn. I use a two minute interval, as five minutes was too long and one minute was too short, but two minutes was about right. I update the Excel Chart as I go along and it has an automatic 50% centering feature, so the trend line stays centered.

Looking at the 0844 AM example, note that the Buy Line (green) bottoms out at 0.243 at 0844 right at the start of the downtrend, then while the downtrend is continuing the Buy Percent increases to 0.2975 at 0846, even while the Candle drops a full point. Then at 0848 you get a good looking candle that might signal a reversal, but... the Buy Percent has now increased to 0.4138 along with the 234 Buys in the Number Bar are indicators that might signal a strong reversal in the trend and make a good entry point.

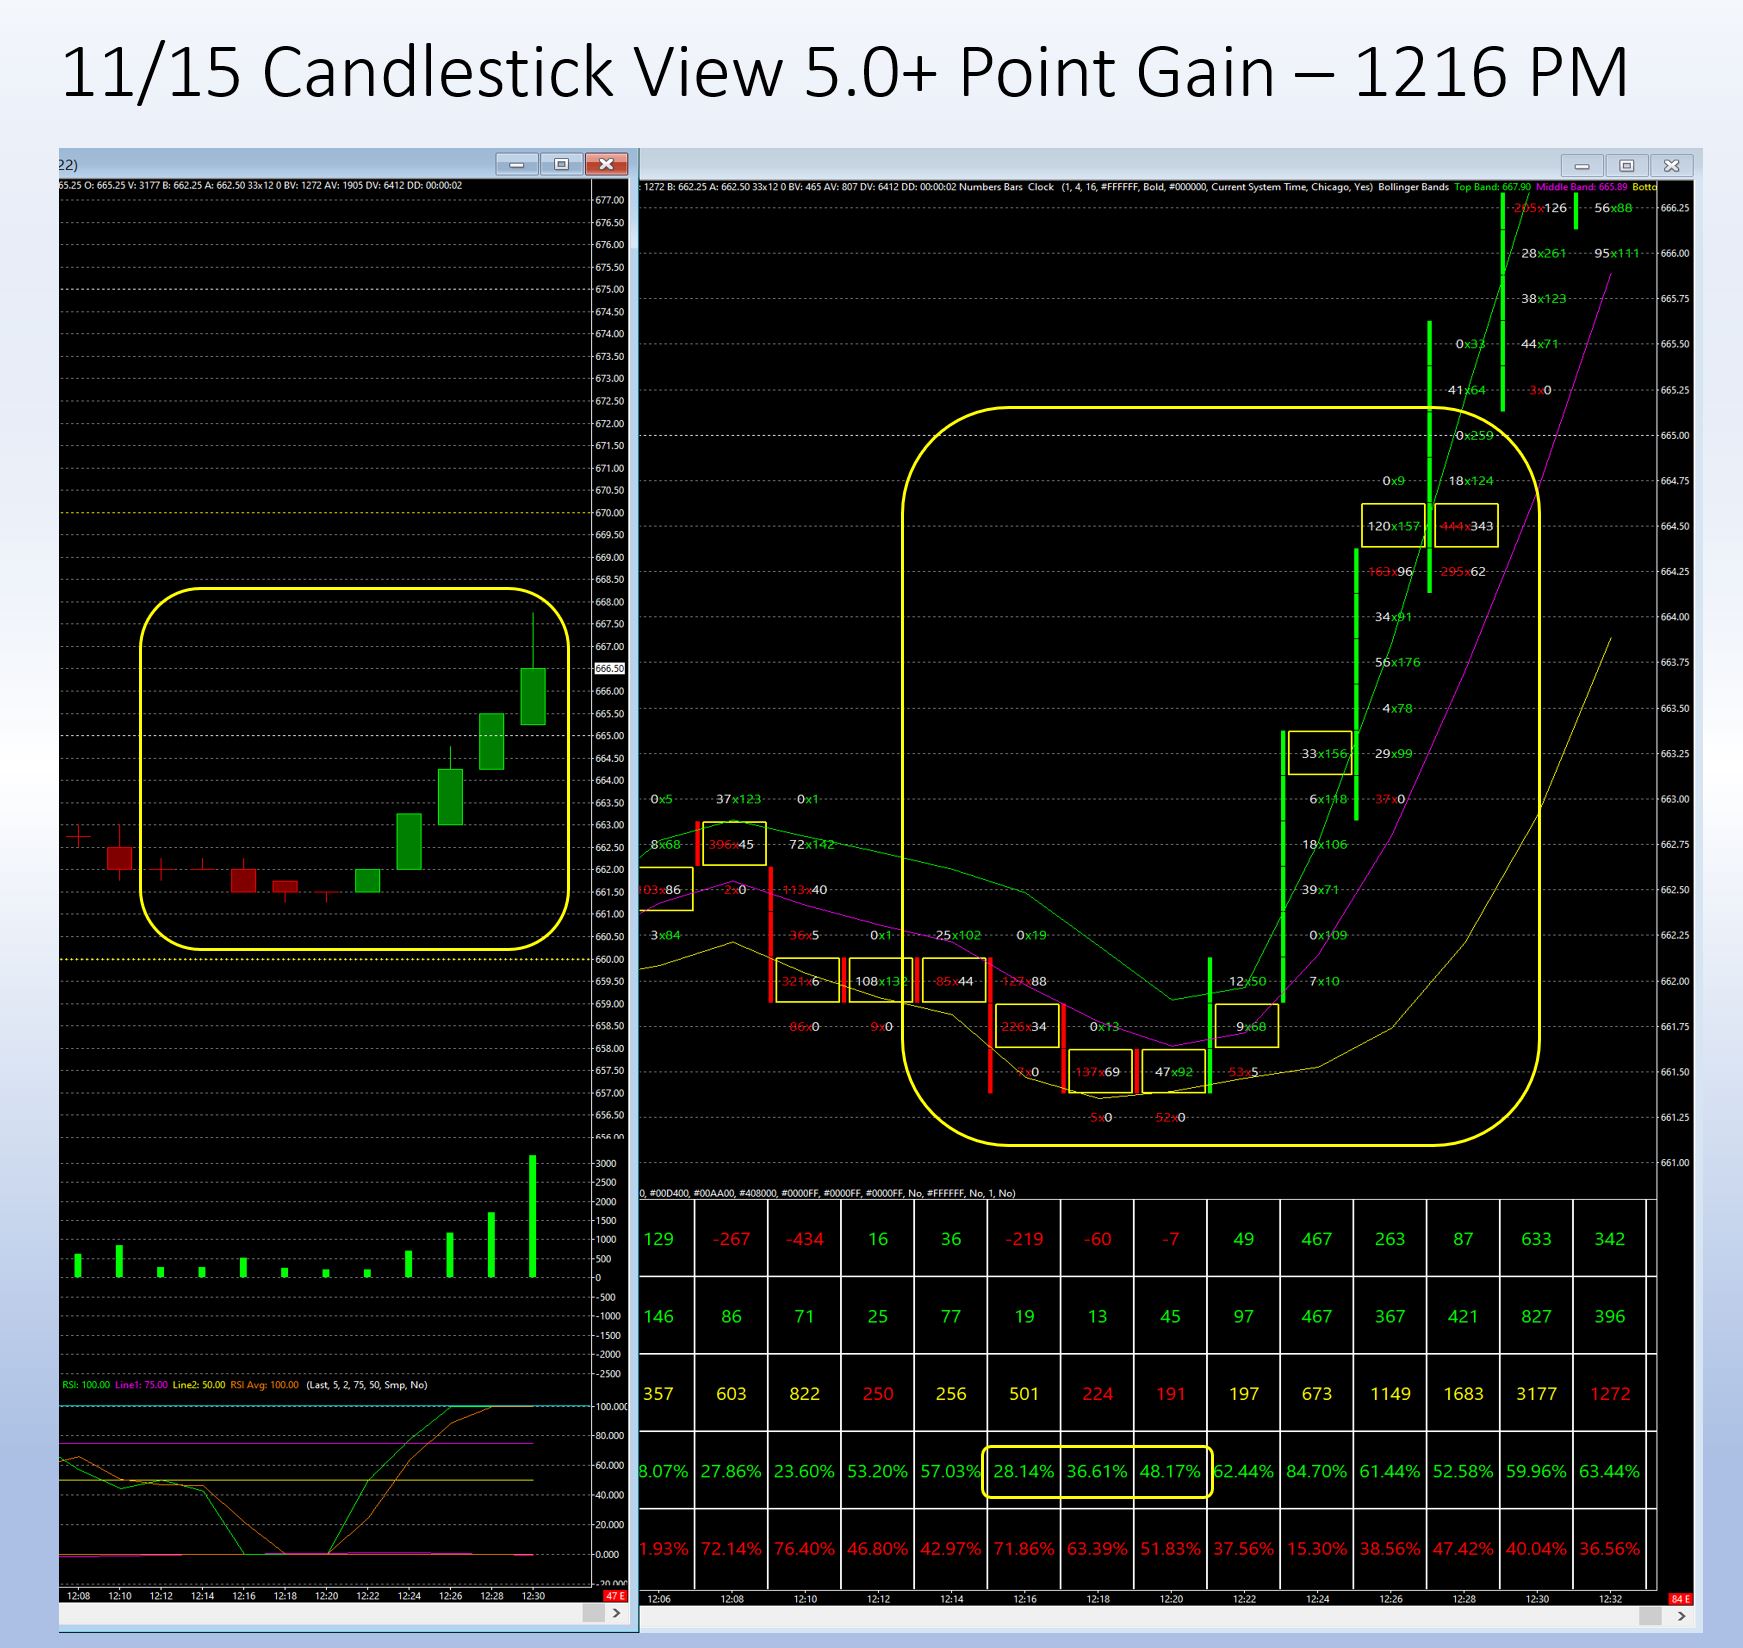
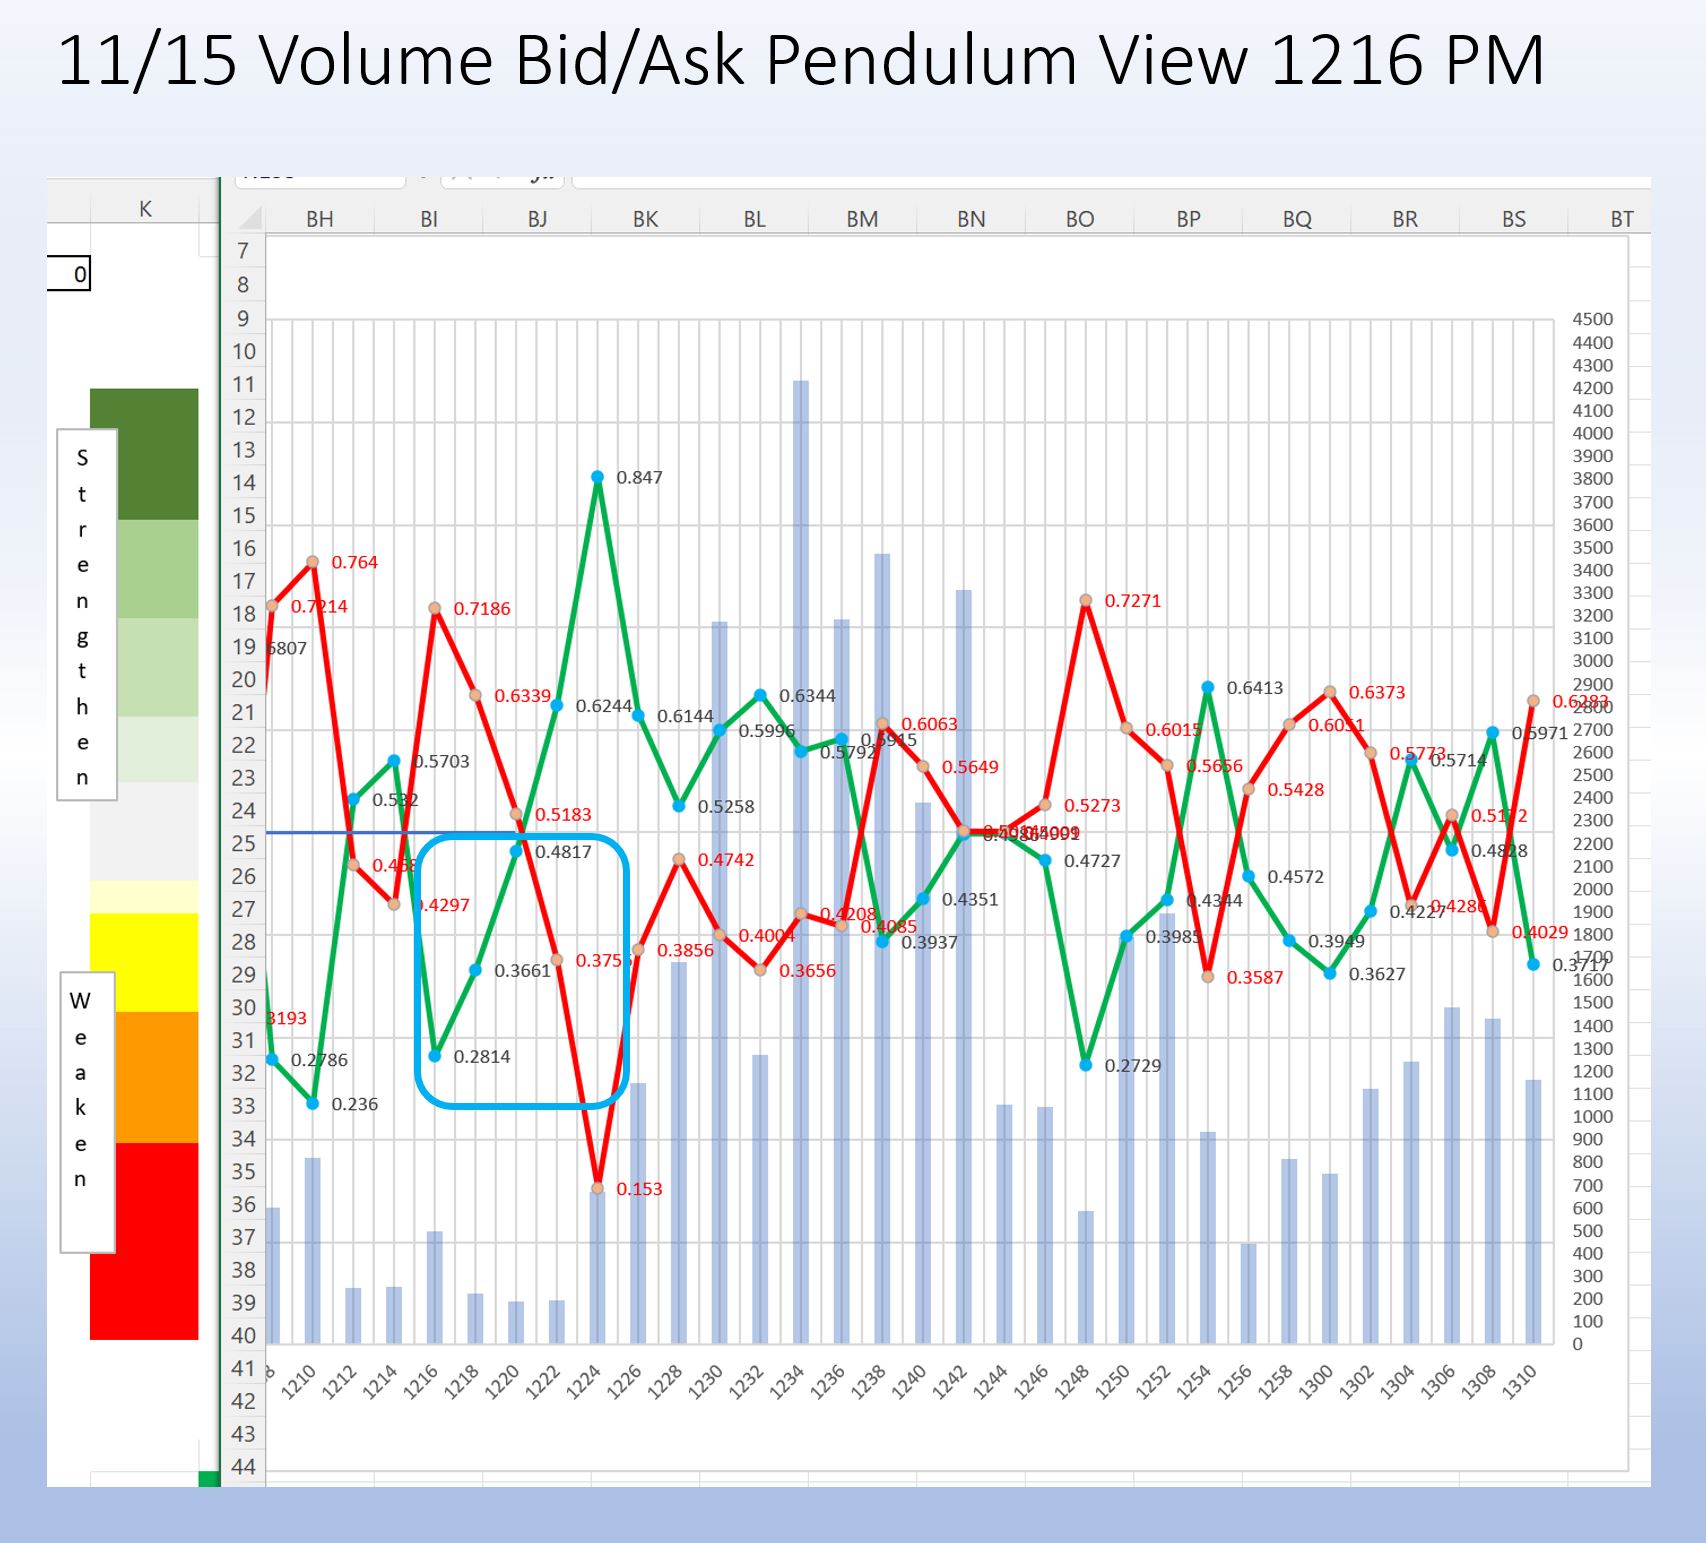
Compare the Candlestick and the Excel Sheet for 0844 AM and also 1216 was exactly the same. I'll be back tomorrow afternoon to answer any questions or entertain thoughts on this. Just something I'm trying out. Thanks for reading.
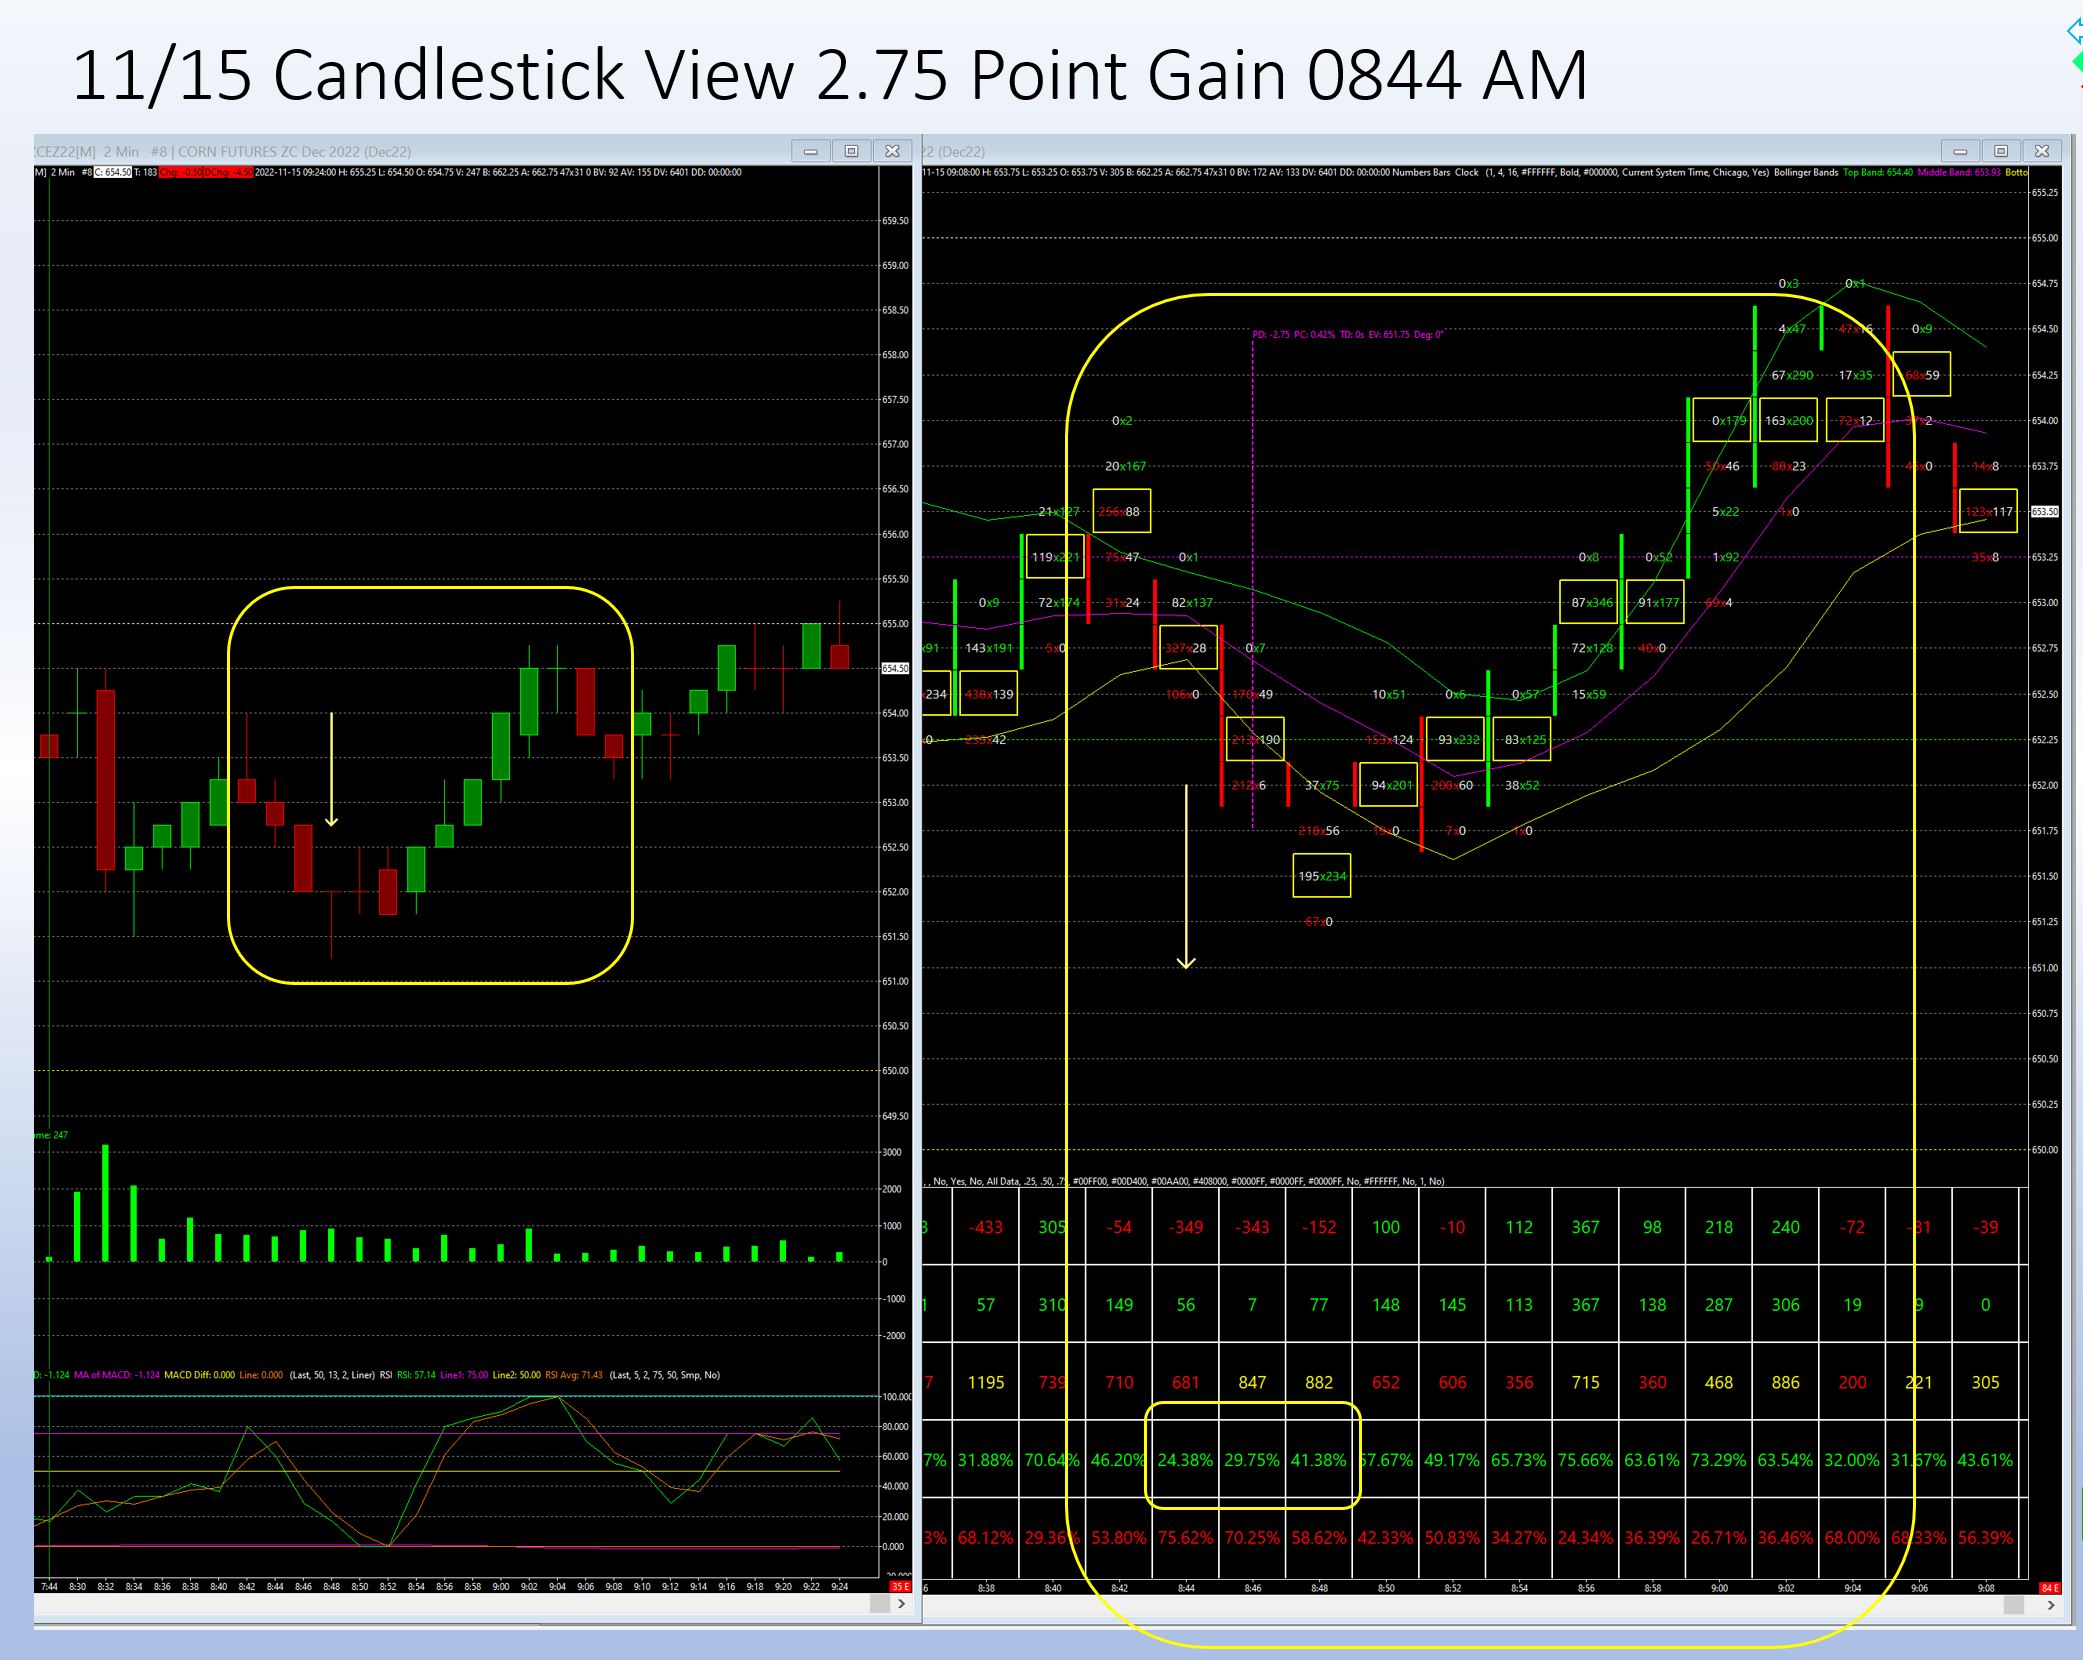


Started this thread Reply With Quote
Thanked by:

Can you help answer these questions
from other members on NexusFi?
Sundays Verdict: Lebanon Locked at 99.85% as Iran June 7 …
Prediction Markets & Event Contracts
Hormuz Normalization Collapses to 19.5% -- Iran Regime F …
Prediction Markets & Event Contracts
Rubios Good News Within Hours and the 30-Day Math: Why H …
Prediction Markets & Event Contracts
CFTC Rewrites the Rulebook -- Kalshi Cracks $1B Non-Spor …
Prediction Markets & Event Contracts
CME Group Fee Schedule Changes Hit All Four Exchanges -- …
Traders Hideout
 
Best Threads (Most Thanked)
in the last 7 days on NexusFi
Sober Journey With S&P
23 thanks
2026 Jlab journal
10 thanks
Algo automated / semi-automated trading anyone?
6 thanks
Lady Vols Primer: Trading Volatility Journal
6 thanks
Trying to learn Volume and price action correlation
5 thanks
  #2 (permalink)
 
gdplus1's Avatar
 gdplus1 
Chicago
 
Experience: Intermediate
Platform: NinjaTrader, MBTDesktop
Broker: Manduca/Rithmic, MBTrading.com, e-futures
Trading: ES NG
Posts: 40 since Dec 2009
Thanks Given: 96
Thanks Received: 31

Here is a good thread on footprint:


Visit my NexusFi Trade Journal Reply With Quote


Last Updated on November 20, 2022


© 2026 NexusFi®, s.a., All Rights Reserved.
Av Ricardo J. Alfaro, Century Tower, Panama City, Panama, Ph: +507 833-9432 (Panama and Intl), +1 888-312-3001 (USA and Canada)
All information is for educational use only and is not investment advice. There is a substantial risk of loss in trading commodity futures, stocks, options and foreign exchange products. Past performance is not indicative of future results.
About Us - Contact Us - Site Rules, Acceptable Use, and Terms and Conditions - Downloads - Top
no new posts