Welcome to NexusFi: the best trading community on the planet, with over 150,000 members Sign Up Now for Free
Genuine reviews from real traders, not fake reviews from stealth vendors
Quality education from leading professional traders
We are a friendly, helpful, and positive community
We do not tolerate rude behavior, trolling, or vendors advertising in posts
We are here to help, just let us know what you need
You'll need to register in order to view the content of the threads and start contributing to our community. It's free for basic access, or support us by becoming an Elite Member -- see if you qualify for a discount below.
-- Big Mike, Site Administrator
(If you already have an account, login at the top of the page)
I'm wondering if there is a way to combine a TPO chart and a composite volume profile into one chart?
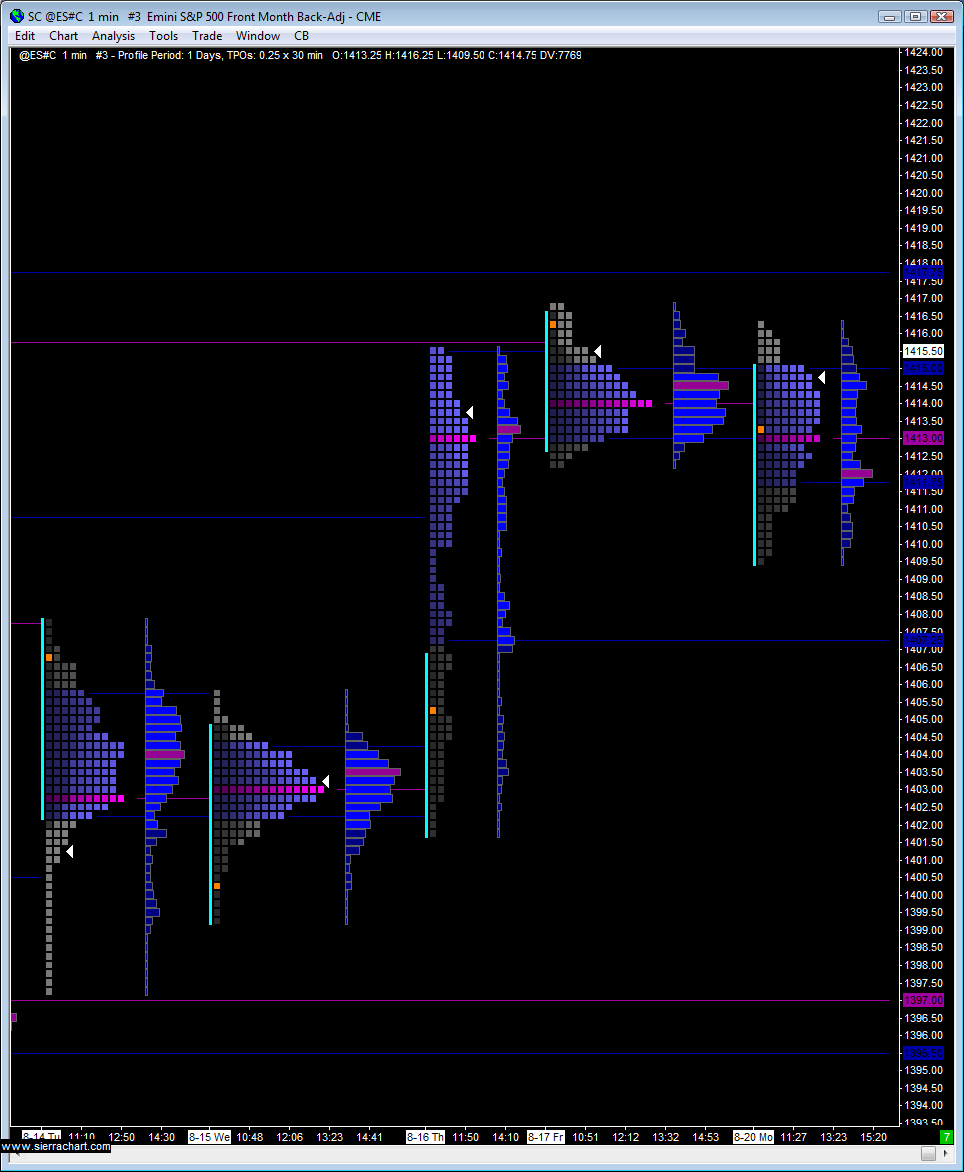
I was looking at Sierra's TPO charts this evening, and realized I really love the way they handle the initial balance indicator visually. Much, much better than what I was doing on my 'medium' 100k volume chart.
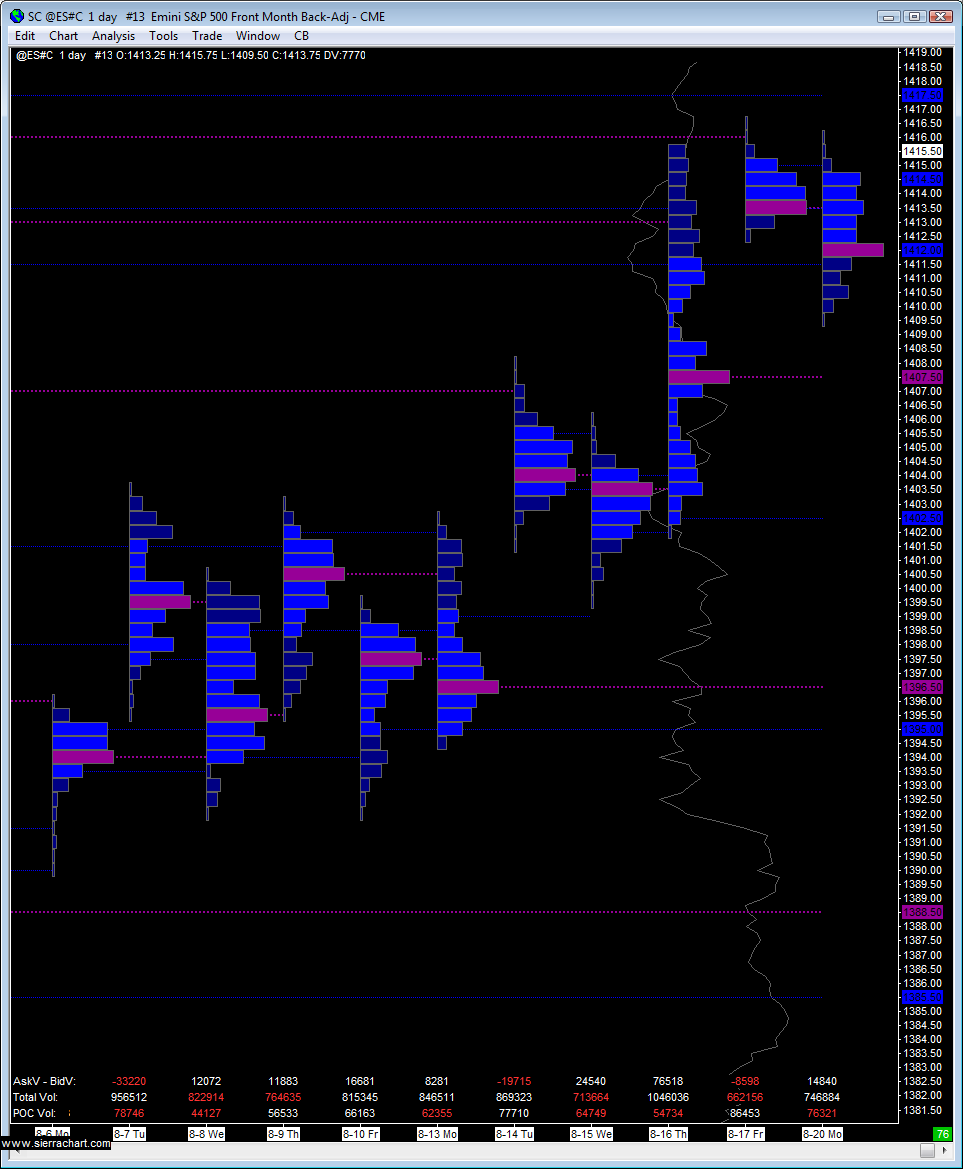
But I can't replace my big 1-day Volume Profile chart with a TPO chart if I can't get the composite profile on the right.
I don't care for the time blocks on a TPO chart, but if you ignore that then it is basically the same as a Volume Profile chart (for analyzing distributions, value areas, points of control). So I might switch to it.
Well, I recharged sierra too since I started a new combine and can tie it to CTS ... and getting back into everything makes me want to look around some more....
I am not sure how you have setup still... but just a comment that you can switch the blocks to letters which may be more useful... I just glanced at volume profile but not sure how to set it up as you have it, have to take a look
kind of neat , I just found out you can slip bidxask in there as well n it's in the settings for vol profile
have to do some digging with more time, sorry not much help...
when i discover anything i'll stick it in journal
"Successful trading is one long journey, not a destination" Peter Borish Former Head of Research for Paul Tudor Jones speaking on conversations with John F. Carter
I'm trying to figure out volume information with Sierra. I'm looking to switch brokerage and platforms from TDAmeritrade / ThinkorSwim. It is much more tricky and would love to see more information or user profiles.
Nope, best I can do is this (which is my main profile chart):
I do keep a VP-only chart handy, which also shows composite profile. But I prefer the TPO chart because of the way the IB, open, and close are plotted on the chart.
I know this has been a couple of years, but to finish the thread for anyone looking for the answer. It is all pretty automatic now, when you add the volume by price study to the TPO chart.
But I am searching for how to setup the volume composite for sierra chart. I think I get the idea, but I can't get the VP condensed tightly to the right side of the chart. Any suggestions?
I know this thread is a little dated... but I asked support abt this very topic last wk & they responded w/ 'This will not work because a Volume by Price study added to a TPO chart will always have the same time periods as the TPO Profiles in the chart. '
I suggested it wld be a cool feat to add in the future.
Try adding a second VbP study along with original VbP that is designed to work with the TPO study. In the the settings for the second one,under draw mode select VP, tick size set to 1, graph period type to draw as one period to fixed end time, set independant volume to yes and finally time period as years. Should work.
Email me and I will forward some screen shots!