Welcome to NexusFi: the best trading community on the planet, with over 150,000 members Sign Up Now for Free
Genuine reviews from real traders, not fake reviews from stealth vendors
Quality education from leading professional traders
We are a friendly, helpful, and positive community
We do not tolerate rude behavior, trolling, or vendors advertising in posts
We are here to help, just let us know what you need
You'll need to register in order to view the content of the threads and start contributing to our community. It's free for basic access, or support us by becoming an Elite Member -- see if you qualify for a discount below.
-- Big Mike, Site Administrator
(If you already have an account, login at the top of the page)
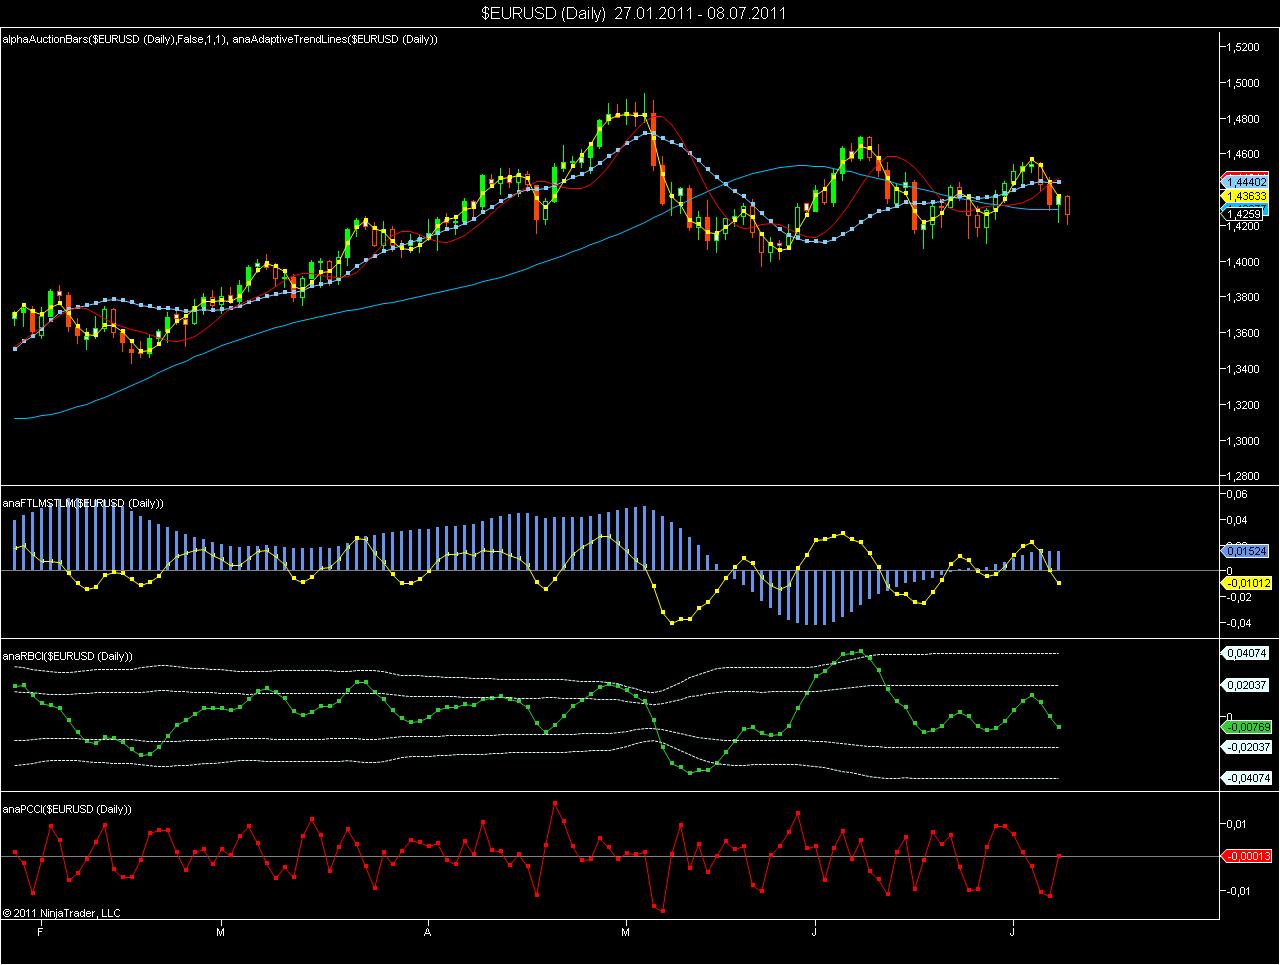
FTLMand STLM are MACD type indicators which are built from digital filters. There are thousands of digital filtes around, and nobody knows which of them works or not. You could also built MACDs from Gauss or Butterworth filters and get similar indicators.
FTLM and STML are built from 4 filters, which are called FATL, SATL, RFTL and RSTL. I checked various sources and discovered that FATL and SATL are more or less the same, while there are several versions around for RFTL and RSTL.
I attach a chart which shows EURUSD between August 14, 2000 and December 2000 to compare with the chart you posted. The RFTL MetaTrader formula does not match the original chart, but leads to different results.
Please again my question: How do you use these filters, and why do you think that these specific filters are better than Gauss, Butterworth, Supersmoother, Nyquist or Jurik filters? Just copying any filter, which was presented 10 years ago without knowing what it is good for is not an attractive task for me.
I'm not really a programmer, the synthesis of this indicator for the use I give, is not exactly normal, but as I said before, I use to remove small sections using it as a curved trend, yn oes that are better than Gaussians but for my operability is more comfortable (in separate window)
I am still thinking about what this indicator is actually good for.
It is a linear digital filter, which uses 235 parameters to produce an individually weighted moving average. The parameters were created over 10 years ago. I do not know how the parameters were generated, but let us assume that somebody used a neural net on EURUSD and optimized the parameters to match a historical period, which was the training period.
Who tells me that such a curve fitted system will perform any better than a collection of simple moving averages?
If I use a similar system based on Gaussian or Butterworth filters, I only need 4 values for the 4 periods to calculate the proxys for the trendlines. I would have more confidence in a 4 parameter system than a 235 parameter system.
Is there anybody who can explain me, how the 235 parameters of this system were generated?