Welcome to NexusFi: the best trading community on the planet, with over 150,000 members Sign Up Now for Free
Genuine reviews from real traders, not fake reviews from stealth vendors
Quality education from leading professional traders
We are a friendly, helpful, and positive community
We do not tolerate rude behavior, trolling, or vendors advertising in posts
We are here to help, just let us know what you need
You'll need to register in order to view the content of the threads and start contributing to our community. It's free for basic access, or support us by becoming an Elite Member -- see if you qualify for a discount below.
-- Big Mike, Site Administrator
(If you already have an account, login at the top of the page)
It would be a real challenge to convert the Polarized Fractal Efficiency to an indicator that can be used.
The basic idea behind that indicator is comparable to Kaufman's Fractal Efficiency, so it is not without any value.
The PFE is only problematic, because its author used a geometrical method for deriving the formula and fell pray to scaling problems. I am convinced that the original idea can still be correctly implemented, if the price scale is normalized by using an apporiate measure for volatility. This could be the true range or the standard deviation.
With a normalized scale the current scaling problem could be handled. Problem here would be to select an appropriate lookback period for volatility. This would also result in a more complex formula compared to the original one. Let us think about it.
Any suggestions for modification of the PFE are welcome.
Since this is true, maybe you can use it on a particular time frame where it works and not on the other ones. Or tweak the default settings to suit the security/timeframe you are using.
I have noticed also that on the default settings on the higher timeframes it's a little slow but pretty effective on smaller timeframes (3min, 5min, 15min etc).
You mentioned that it could have merit and it's flaw can be fixed. Would you know how to do that?
Also, what does everyone think of the "Smoothed RSI Inverse Fisher Transform" indicator? That's another one I'm looking at
The Inverse Fisher Transform is a way of visually changing the appearance of an indicator. You can apply this to the RSI (which is most common), but you can also apply the Inverse Fisher Transform to other indicators.
This is what you need to do: First nomalize the indicator to display values within a range from -5 to +5. Then apply the transformation formula.
This what you get: After the Inverse Fisher Transform you will get sharper signals compared to the original indicator. The transformed indicator will only stay a limited time in the middle of the value range, but mostly switch from the overbought to the oversold region and back.
The Inverse Fisher Transform is particularly suited as a trendfilter, if you apply a transformed indicator to another indicator.
Example
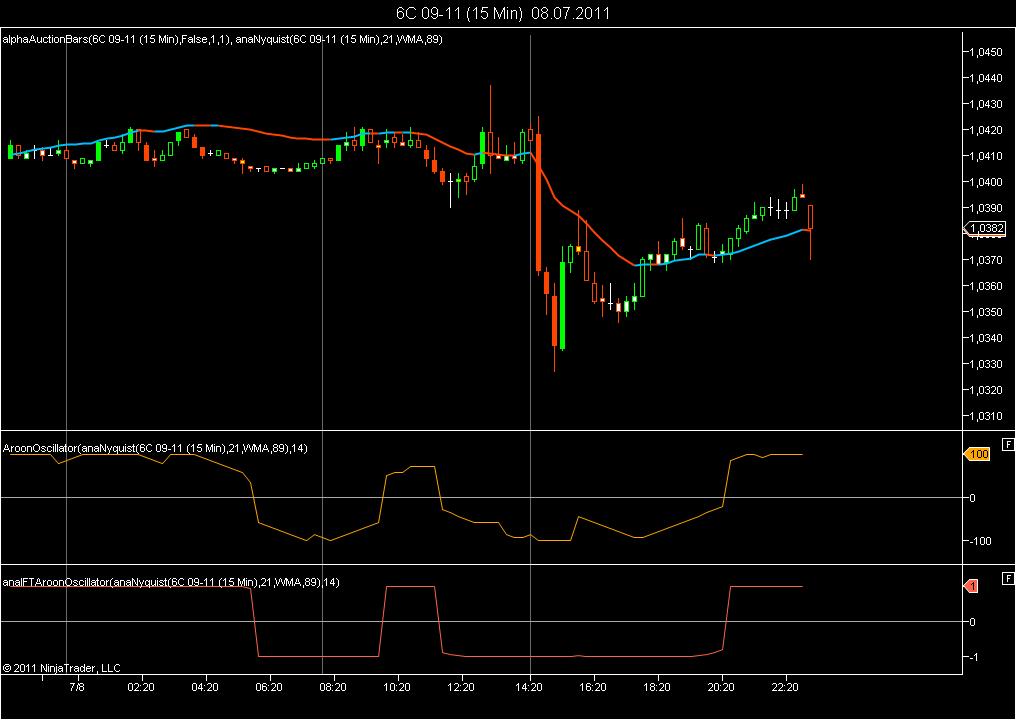
Below you can see a 15-minute chart of the September Loonie future.
On the main panel you will notice a Nyquist moving average. If I apply the Aroon oscillator to that moving average, I do not get clear signals, which can be used as a trend filter. However, the Inverse Fisher Transform of the Aroon Oscillator however gives very clear signals on the market being in long or short mode. The indicator is attached.
The Inverse Fisher Transform can be applied to any oscillator which displays values within a fixed range, such as the Stochastics or the RSI. If you want to apply it to the MACD, you first need to normalize the MACD.
Thanks again Fat Tails for the reply. Do you use it or think it's good at filtering out false moves or signaling the main part of a move? Well at least you didn't say it was flawed
The Inverse Fisher Transform just vertically expands the middle part of the indicator panel and compresses everything above and below. For example if you take the RSI, the original ranges and the projected ranges are
range before projection 50 / 55 -> range after projection 0.00 / 0.46 (strongly expanded)
range before projection 55 / 60 -> range after projection 0.46 / 0.76 (strongly expanded)
range before projection 60 / 65 -> range after projection 0.76 / 0.91 (slightly expanded)
range before projection 65 / 70 -> range after projection 0.91 / 0.96 (compressed)
range before projection 70 / 100 -> range after projection 0.96 / 1.00 (strongly compressed)
The result is more similar to a digital filter. Once the original RSI crosses the midline at 50, the Inverse Fisher Transform will quickly move into ovebought or oversold territory.
So basically it allows you to focus on the crossing of the midline.
I call an indicator normalized, if it uses a fixed range of values irrespectiveley of the instrument or the timeframe. RSI or Stochastics will always have a value between 0 and 100, whether you use them on 1 min EURUSD chart or a daily ES chart.
The MACD is also an oscillator, but its default version is not normalized. If I apply it to a daily chart of YM, it can take values of above or below 150. If I apply it to a 1 min chart of EURUSD, the value range is between 0.0005 and - 0.0005, which is quite a difference. See charts attached. So if you know, that the MACD > 1, it has no general meaning, if you do not know both instrument and timeframe. If you know that the RSI is above 70, the meaning is the same for all instruments and timeframes.
So you can classify indicators:
normalized indicators : have the same value range for all instruments and timeframes -> example: RSI and Stochastics
partly normalized indicators: have a similar value range for all instruments for a given timeframe -> example: ROC (rate of change)
non-normlalized indicators: have different value ranges depending on instrument and timeframe -> example: momentum and MACD
incoherent indicators: have different properties depending on instrument and timeframe -> example Polarized Fractal Efficiency
The Inverse Fisher Transform is a non-linear transformation, which requires that the value range of the indicator is converted to a fixed range between -5 and +5. For the RSI this is simple to achieve: deduct 50 from its value and it will oscillate around the zero line, then multiply all values with 0.1 and the values will be comprised within - 5 and + 5. Now you can apply the Inverse Fisher Transform. IF NRSI is the normalized RSI the Inverse Fisher Transform can be calculated as