Welcome to NexusFi: the best trading community on the planet, with over 150,000 members Sign Up Now for Free
Genuine reviews from real traders, not fake reviews from stealth vendors
Quality education from leading professional traders
We are a friendly, helpful, and positive community
We do not tolerate rude behavior, trolling, or vendors advertising in posts
We are here to help, just let us know what you need
You'll need to register in order to view the content of the threads and start contributing to our community. It's free for basic access, or support us by becoming an Elite Member -- see if you qualify for a discount below.
-- Big Mike, Site Administrator
(If you already have an account, login at the top of the page)
(1) The SBS Renko bars are somewhat flawed. My multitimeframe indicators work with NinjaTrader default Renko bars and they also work with BetterRenko charts, but they cannot use SBS Renko.
(2) If you want to have the rays printed from a (genuine) 6 tick and a 12 tick chart, this is pretty easy. You do not need to code anything. If the ray strength is 5, just apply the indicator a second time with ray strength of 10. A ray strength of 10 on a 6-tick chart is equivalent to a ray strength of 5 on a 12-tick chart.
(3) The above logic holds true for minute, tick and volume charts, but not for range or Renko charts. If you want to display the rays of a 12-SBS-renko chart on a 6-SBS-Renko, you can use the square of the ray strength selected for the 12-SBS-Renko chart to derive it from the 6-SBS-Renko. This is not an exact but an approximative value.
Example: You wish to display rays with a trend strength of 5 derived from 12-SBS-Renko. So you would enter a ray strength of 5 * 5 = 25 into your 6-SBS-Renko indicator, and it should display what you look for.
I have looked for a way to code "false" multi-timeframe indicators from a single bar series. This has both advantages and inconvenients compared to real multi- timeframe indicators.
Advantage: Only loading 1 bar series, faster loading and calculation, robustness.
Inconvenient: The concept is limited to the same bar type, you cannot create range bars from minute bars, you only can create integer multiples of minute bars. The implementation uses artificial composite bars which are stocked in expandable ArrayList obejcts. These are the possible implementation.
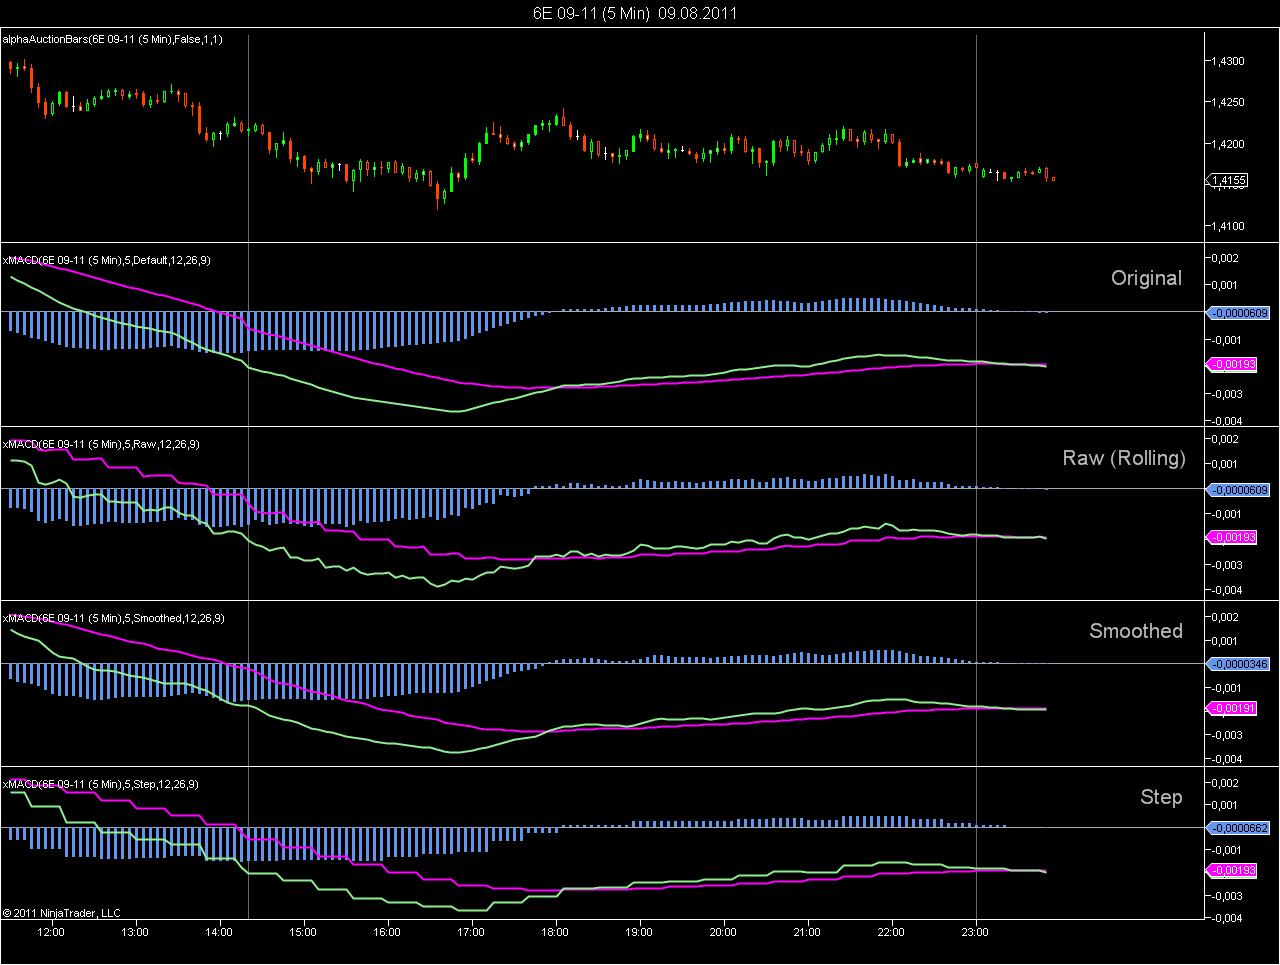
(1) Replicating the higher timeframe indicator values. Below you will see the 25 min MACD calculated from a 5 min bar series. The Default mode reshapes the original NinjaTrader MACD as shown on a 25 minute chart. This requires repainting within the last unstable period of the composite bar. This makes the replication of the 25 min MACD less attractive for strategy applications.
(2) Raw mode shows the indicator values as calculated on a rolling basis without smoothing. The raw mode is useful, it the indicator values are accessed by another indicator or strategy, as it does not repaint.
(3) For use as a visual indicator with a slightly higher resolution than the original 25 min MACD, the raw values can be smoothed over the composite bar. This visual indicator does not repaint either, the smoothing introduces a small acceptable lag.
(4) The higher timeframe values can also be shown as a step function, which reflects the values as generated by the composite bars. The step function repaints 1 tick at the session end, as the session end is often charaterized by an odd period, which can not be predicted from the multplier used to generate the composite bars.
Chart attached for illustration: The concept can be applied to any indicator.
Your idea would work for a simple moving average. A 60-period SMA on a 1 min chart, would come quite close to a 12-period SMA on a 5 minute chart. Please see chart 1 below for comparison.
However, a 60-minute EMA on a 1 minute chart is already a little bit different from a 12-period EMA on a 5 minute chart, because of the recursive formula. See chart 2 below.