Welcome to NexusFi: the best trading community on the planet, with over 150,000 members Sign Up Now for Free
Genuine reviews from real traders, not fake reviews from stealth vendors
Quality education from leading professional traders
We are a friendly, helpful, and positive community
We do not tolerate rude behavior, trolling, or vendors advertising in posts
We are here to help, just let us know what you need
You'll need to register in order to view the content of the threads and start contributing to our community. It's free for basic access, or support us by becoming an Elite Member -- see if you qualify for a discount below.
-- Big Mike, Site Administrator
(If you already have an account, login at the top of the page)
I am curious about the relationship to the dollar to oil and (also to the equities market) any ideas on just how that works. Does the dollar, lead the way on that one? Does oil run second place on that?
Also, does anyone have advice on a charting service? I am still choosing a trading platform. I was not impressed with Ninjatrader's charting. I just signed on to Ameritrade's Think or Swim and I think I lite that better already. I do a lot of extensive chart studies and yet I have not yet found anything better than investing.com which offers a great charting service however they don't list certain futures that I would like to look at.
I don't care if the charting service is different than the platform I choose. Any recommendations just on charting??
Thought id post for once.
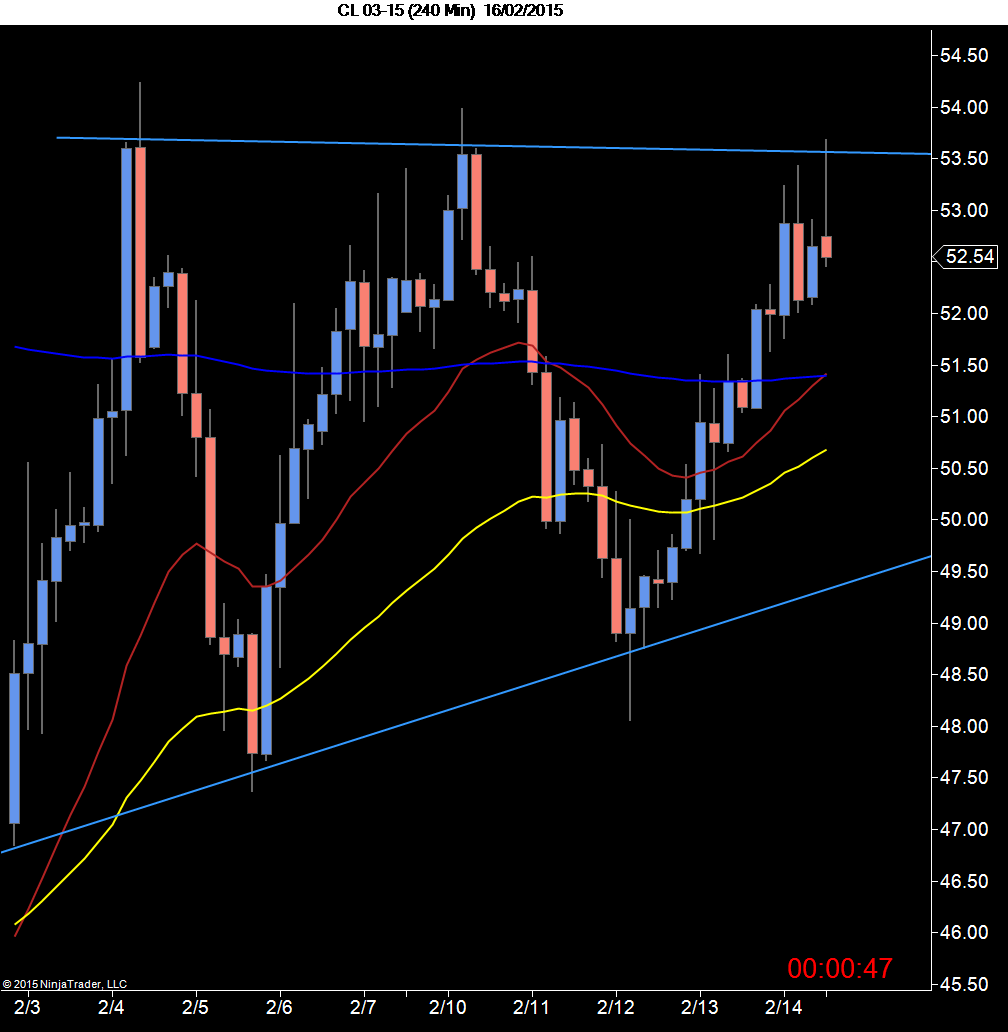
CL been somewhat tricky to trade lately. However putting things into context I was following this 4 hour chart closely.
Trade was taken within Asian session right at market open. Shorted a FLUSH up then loaded.
First trade was stopped out at 40 ticks. In like 2 seconds. Very dangerous with thin liquidity.
Id be curious to see if we go down to 50?
Here's a study I'm currently working on. I've set the study to mark the high and low of each two hour time frame. Start time is 0200amET and end time is 1500ET.
When looking at the "count number" it is the number of occurrence long or short. For example if the high or low at 2am was at the top of the hour it would get a one or two (one is high and two is low.) If the high was at 215am it would get 1.25 and if 245am it would get 1.75, reverse for low would be two respectively.
As you can see the 1500ET window is blank and so far the spreadsheet has 41 records. As I enter in more records I suspect the "time bin" will not change much only an increase of occurrence.
How do I know this? On my M1 chart I have marks at the hour, half hour, fifteen minute and forty-five minute. I've been tracking this on /6E and /CL.
Pink Floyd is a valuable yard stick that can give an edge
Cl is correcting back towards the prevailing trend line. Currently in a sideways pattern. It seems the target of the correction will be the convergence of the trend line and the noted area of congestion. Key level is 53.45. Then 54.19. Above these levels one would expect the congestion area to be hit. The alternative is that there is a 5 wave price pattern underway. This view would call for a fall back to the lower support line. Will have to trade it as it happens.
"What do you have on the burner?" I've outlined this in some previous posts but there's a price action (participation) phenomena with both /6E and /CL that happens at time of day (outside of news.) So the XLS is a manual recording …
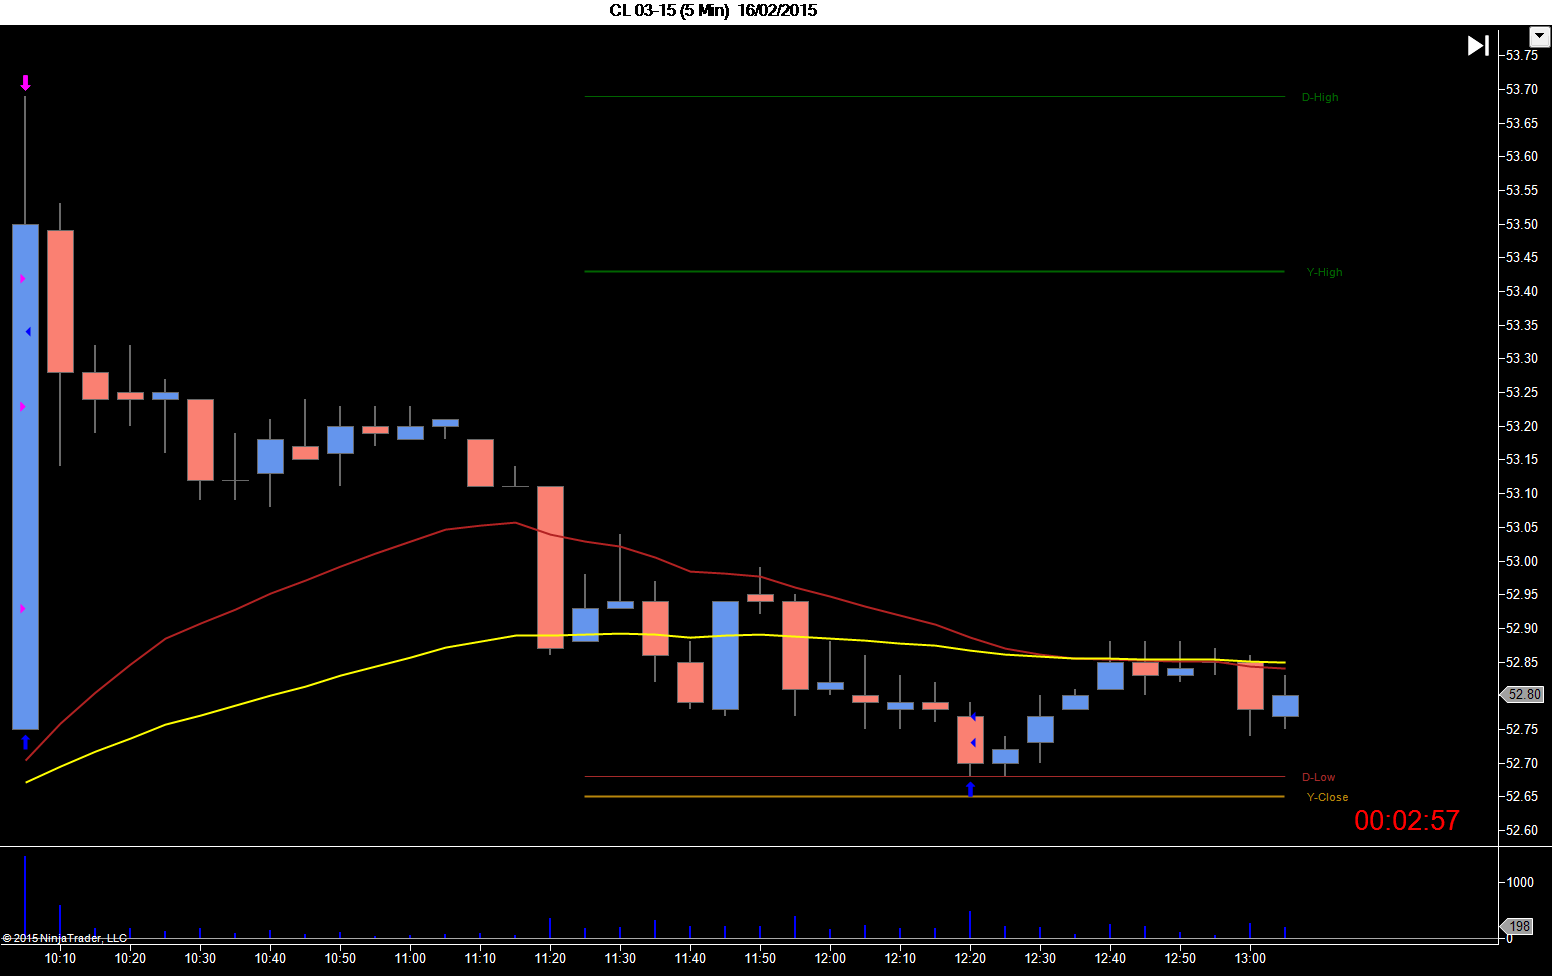
I shorted between 53:10 to 52:80 based off 240 min context. US session finally paid off on move.
I like trading this way. Just VERY HARD to execute entries and manage their risk!
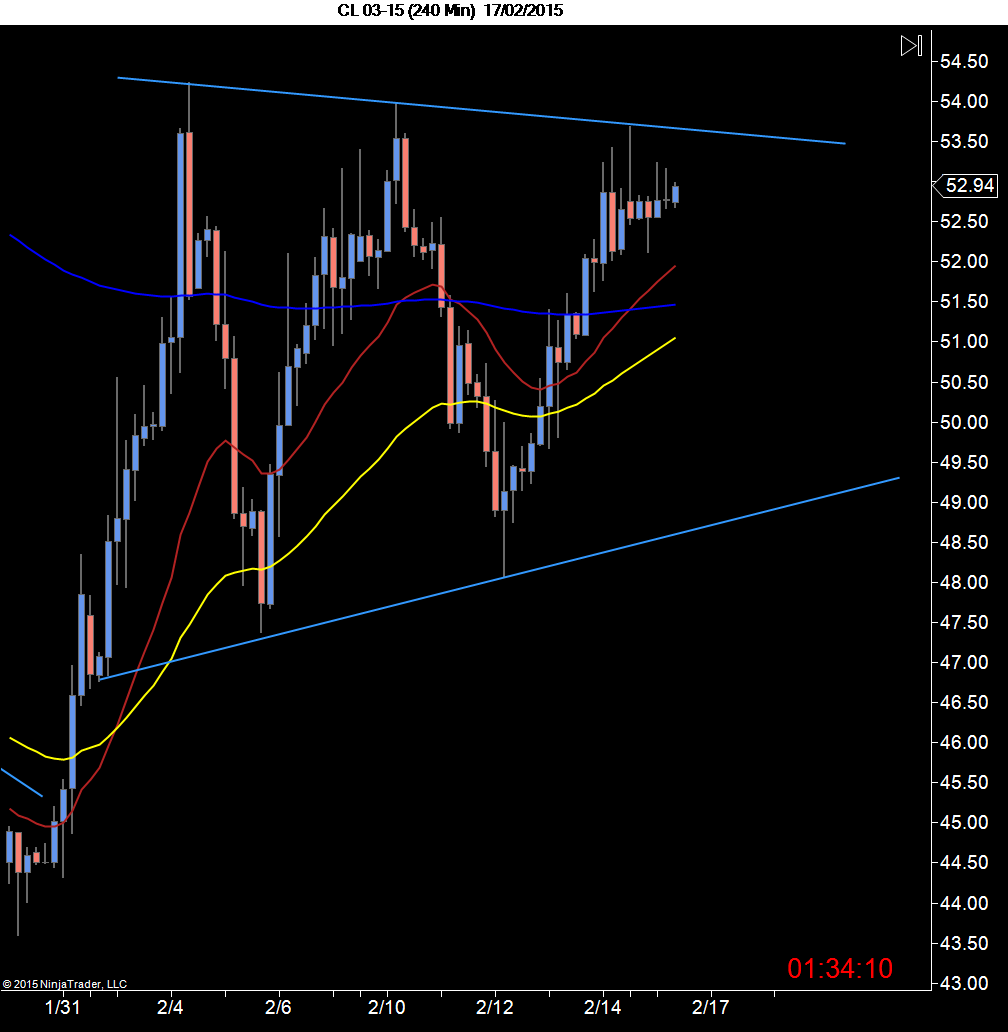
Hope we see 51 - 50.50 this week before rollover.
FWIW my targets are 51.21 and 50.71 and would like to at least see the top one hit today. I have been waiting on this sell-off as well. The poor holiday action drove me crazy...haha.