Welcome to NexusFi: the best trading community on the planet, with over 150,000 members Sign Up Now for Free
Genuine reviews from real traders, not fake reviews from stealth vendors
Quality education from leading professional traders
We are a friendly, helpful, and positive community
We do not tolerate rude behavior, trolling, or vendors advertising in posts
We are here to help, just let us know what you need
You'll need to register in order to view the content of the threads and start contributing to our community. It's free for basic access, or support us by becoming an Elite Member -- see if you qualify for a discount below.
-- Big Mike, Site Administrator
(If you already have an account, login at the top of the page)
I am NOT THE AUTHOR and to me its clear as the day has 24hrs in it.
Here is another person who took a look at it and was a former CME/CBOT floor trader who owned 2 seats ( retired now) and what he said.
"I tried to read as if I was ignorant, I cannot understand how people dont understand whats being stated.
It's really simplistic as all hell, yeah it wld take a bit of work, chart studying and yeah a few good reads of Dawg's blog but the principles are so plain and easy to visualize. I'm left w a huge WTF
Maybe vanilla isn't a colour many can see?"
Enough said!
Can you help answer these questions from other members on NexusFi?
Try to ignore the MACD (remove it from your charts if you are comfortable enough, or even if you are not) and instead think about what is happening to produce the divergence you are referring to and focus on price action.
If the market is smacking really hard and we are coming up to a 15M level say, what do you think the chances are of us bouncing off that 15M level and popping say 10-15 points on something like NQ? The blog talks about slowing of momentum, which is in effect incoming volume that is less bearish/bullish (depending on whether market is going up/down, so if market is smacking hard it is clear incoming is less bullish or we can see there are not many bids if you prefer - see below) than that which preceded it.
If you have seen the TIDDI videos, in one of them he mentions how markets drop on no bid (one of the recent ones), NOT on mass selling. Think of an auction house selling a painting, if they start the bidding at say £2,000 for some POS painting that no one wants there will be no bidding, so what do they do? They have to reduce the price in order to attract bids, there is no other way to achieve a sale - otherwise they just keep it. This isn't really an analogy - markets are an auction, albeit two way. So if no one is bidding, price just keeps coming down.... The opposite could be described as asking - lots of bidding, not much 'asking'. This is a high level way of looking at it, but hopefully explains the background.
Think of this in a market situation - if people are going to start bidding, the market will slow in its downward momentum. So, all divergences are is an indication that the market is slowing as we come into a level - could be any level, if you are good at identifying turning points and then take into consideration slowing on an adjacent time frame (so say you have a 15M level, you see slowing in a 5M chart or 3M etc.), you put the odds in your favour more significantly. So basically you can read the slowing in momentum via price action and naked candle sticks/bars, you do not need the MACD and indeed the MACD can make it harder for some as they wait for divergences prior to getting in.... This is waiting for confirmation and bad - what you really want to focus on is identifying the correct turning points and the slowing of momentum into them.
If you think about it, this is also how accumulation/distribution works, as big players do not buy all they want at once, they get in as the market comes down into the key levels they are watching - hence slowing of price action/momentum.
The blog has been really useful and i have read a couple of times and every time i read it my form picks up in trading especially by the end of the blog but the problem is, i always seem to lose sight and end up making the same mistakes, i've struggled for quite a while now to try and get this on paper as a strategy since all traders always say stick to your system but i never know how to tie it all together into one piece of analysis to get a trade out at the end.
Have any of you guys had success trying to get the method down onto paper, if so could share it or give advice on how to make this into something you can trade off without always feeling like i am missing something. Thanks
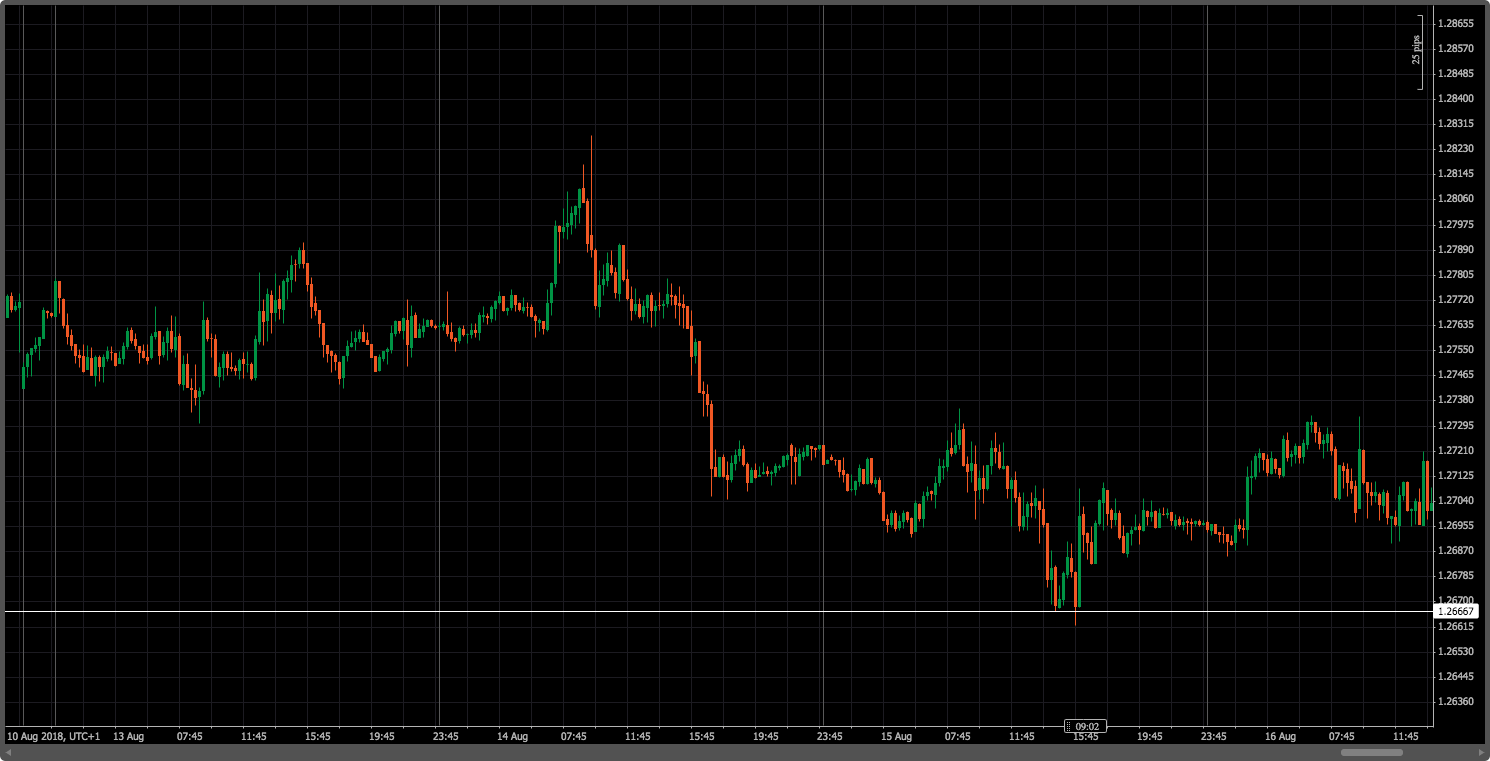
Thanks i agree with that i think that may be why i am still failing but how do you know momentum is slowing on this chart for example, since the level is a h1 and the chart is from a m15 and it looks like it slows down going flat but as we get towards the level price start accelerating downwards with the red candlesticks getting bigger and bigger but it still bounces off? Thanks
That just looks like typical slowing to me, we even spent the best part of an hour and a half around that area before pushing higher, sounds like something beginning with a...
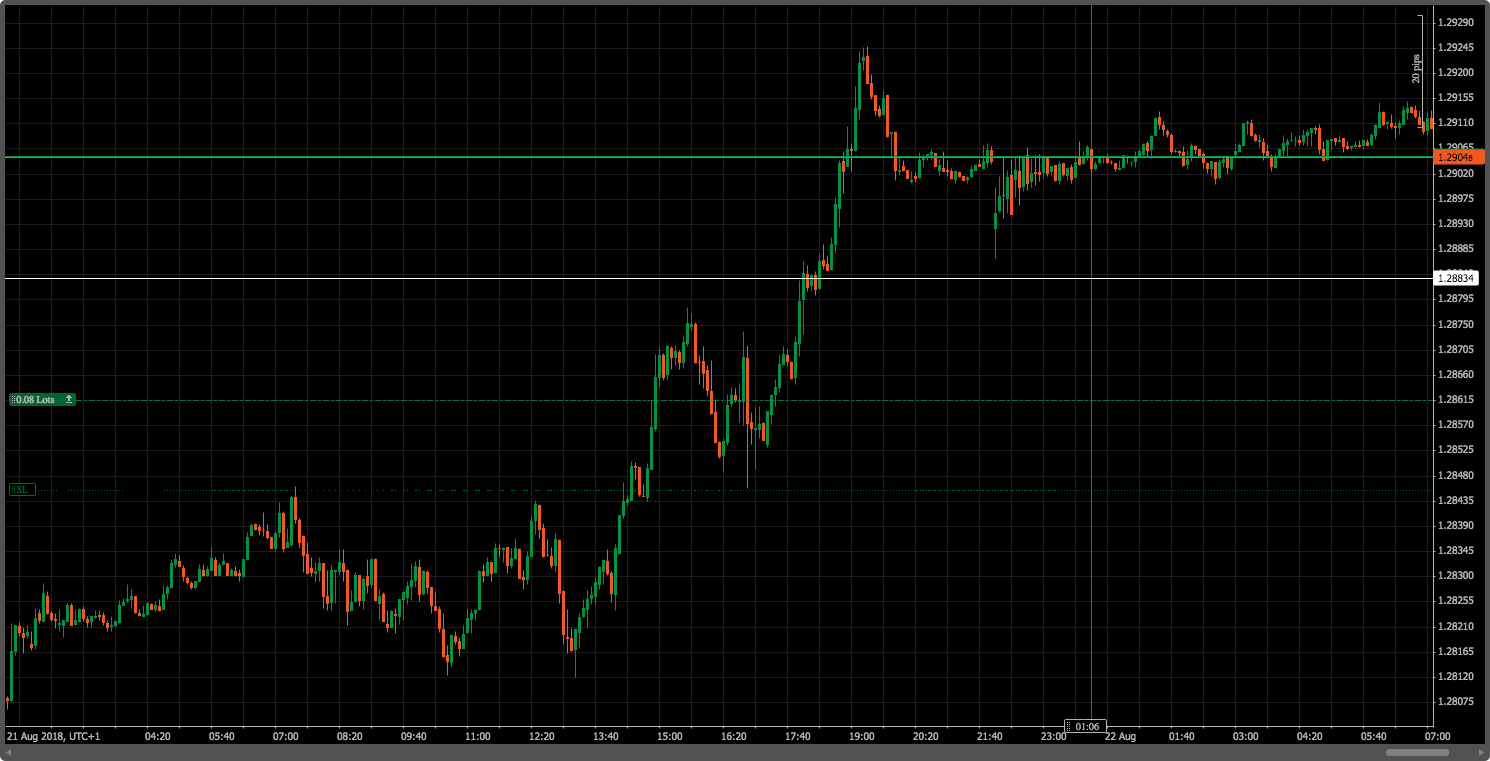
haha accumulation by any chance. But what about this on gbpusd yesterday we had a short level on the m30 from quite a big legstart and on the m5 it looks like momentum slowing similar to the other long level but price eventually blows through it. The target for a level is the support lost leading in to the level is it not? so how do you know if the accumulation/distribution and slowing off momentum will be enough or just a temporary pause? Thanks
(the white line is the level i am talking about, the other is just a pending order)
I think progression was the cause, since it looks like a higher timeframe was in an upleg, but then again it could of been a scalp against the main trend however i am not sure what determines the difference between that potential scalp and scalps that are successful- what is a front run? and you said to stop using macd and i do agree with that but how can you see stuff like macd divergences without it? Thanks