Welcome to NexusFi: the best trading community on the planet, with over 150,000 members Sign Up Now for Free
Genuine reviews from real traders, not fake reviews from stealth vendors
Quality education from leading professional traders
We are a friendly, helpful, and positive community
We do not tolerate rude behavior, trolling, or vendors advertising in posts
We are here to help, just let us know what you need
You'll need to register in order to view the content of the threads and start contributing to our community. It's free for basic access, or support us by becoming an Elite Member -- see if you qualify for a discount below.
-- Big Mike, Site Administrator
(If you already have an account, login at the top of the page)
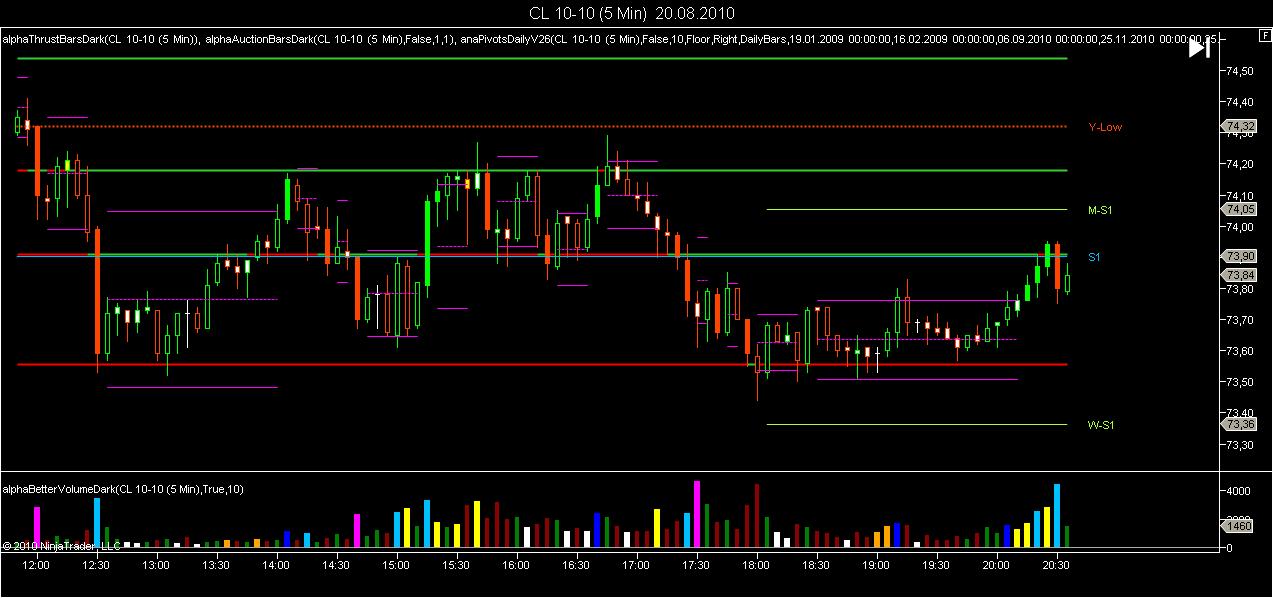
Oh and FWIW: I've attached two different versions of the same chart above to show what its like for me to trade without my levels and volume. The first one would be like trading while highly intoxicated, and the second would be like having one eye closed AND also being highly intoxicated. Point being, I'm blind if I trade without volume, but without my levels volume is worthless to me becuase I wouldn't know when and where to to take my profit or when to take a loss and determine where to reenter.
In my examples of impared charting all we see on the day is the daily S1. Yes, the S1 played a role in the day's trading opportunities but it needed supporting staff: prior-day/muti-day levels of the daily and weekly pivots. Without them I feel traders are driving impared.
How can anyone with consitancy (which we all know is one of the vital cogs to long-term success in this game) and relative precision determine what price was going to do throughout the day? If I'm missing something, I'm certainly open to learning. Remember, not everyone trades trades 1,2,3,4,5 contracts a side, I personally put alot on the line at times (based on level of confidence at specific price points) and would never be able to feel good about a heavy order if I didn't see volume and levels.
Do not understand all the lines on your chart, could you explain, below I added support and resistance which I use for trading. All levels on my chart plotting automatically.
My daily pivot S1 was at 73.90, yours at 73.92 - can you explain the difference, or how you got yours?
See attached Fat Tails. As for the discrepency on the different S1 prices, I'm miffed. maybe someone can chime in as to why. I see we're both looking at the CLV0, so this is odd to me too. However, I remember reading the tape/price action specifically at that level and I recall .92 acting more like a normal pivot as opposed to .90. I may be wrong though.
I must also say fellas that the double denial of price in the 74-teen/low twenties range that is seen at 9:35 and 10:40 is a good sign of what was going to come considering that the market was as low as 73.5x earlier in the session. Anyone who follows price action of the CL knows with relative certainty that CL prices hate looming around in the teens for so long (its a sign of weakness when the market stays in there after a nice reversal of price). Especially considering how they marked the market up nearly 80cents from the morning lows, to not be able to breach 74.30 or stay above 74.20 with any authority really was a telling sign for future downside movement. When price is rising on the CL, after pairing some reasonable downside pressure, to not be able to make it out of the teens is an insult to the bullish side of the market. The smart money saw that, I swear it. On the CL, its important to know that in order for the bulls to take over and possibly get to the next "dollar level" they need to make it to the half way point (XX.50). In order to make it to the half-way point there needs to be support/somewhat robust buying volume over the "teen level" because the teens are just far too close to the lower dollar level (in this case 74.00) to eventually start interesting the shorts for another move down. It's unimpressive for CL prices to be in a downtrend for a couple weeks and to not be able to breach the teens of any give price (74,75,76,77, etc) with a little authority is insulting to prices being bullish for that specific moment in time IMHO. Therefore, I personally prepared for lower prices, even though I will admit I was short before that second top but just added to my initial position once the stars alligned, then went heavier.
I hope that what I just tried to aticulate here wasn't too confusing. Its the tape reading side of my trading and having an intimate relationship with a specific instrument can be helpful to a certain degree will say.
In Market profile the intervals of time, or period are generally 30 minutes long. In essence its a 30 minute candle or bar chart except that instead of candles or bars you have what are called TPO's or Time Price Opportunities and each TPO period is indicated by a letter. In the first 30 minute period of the day say from 9:30 to 10 would be period A and A is used for the entire 30 minute period. From 10-10:30 that would be period B and it is used for the entire 30 minute period and then C,D,E until the close. Every time price prints at a level the letter for the corresponding TPO period is printed. For example, lets say at 6:45 am price hits 75.00. Since that is the first period of the day you would see an "A" at 75.00. Depending on the interval or period of the day a corresponding letter would print at the same level of 75.00 if price were to trade there. So, the time component comes into play in two forms. There could be more, but I know of two. 1) If price spends very little time at a price you will see very few TPO prints. Lets say price opens at 75.00 and starts to move away immediately and doesn't come back to 75.00 all day. You would see "A" at 75.00 and that's it. Lets say price stops at 74.00 in the same "A" period and begins to "consolidate or oscillate back and forth between 75.10 and 74.90 the rest of the day. That means that every other TPO period or interval for the rest of the day would see or touch the price of 75.00. You would see A,B,C,D,E,F,G,...etc all printing at 75.00. That would mean price is spending a lot of "TIME" at this level. I will stop here, but I could go on. See the pic for a visual.
Forgot to say that the reason time is important is because if price is spending a lot of time at a price or zone it means price is in balance. Both sides agree on value. Once price moves away directionally from this area of balance, or where a lot of time was spent, it can be considered to be support or resistance depending on the direction of the move. The reason why price that spends little time in an area is important is because, if it is in deed true that it takes volume to move price away from an area swiftly leaving only TPO prints from one time period (AKA single prints), that can be considered institutional or big money activity. The concept is that they will defend their positions if price were to return.
David
I understand that with T and S you have a buy for every sell etc. With that said, how then can reading the T and S be helpful. How do you make the determination who has control? I thought if you see red it means the bid is being hit and if green the offer. So if you see a waterfall of red then the market is being sold off.
I appreciate the consideration regarding the topic, but its fine with me. I appreciate the discussion, viewpoints and education even more, so feel free to post.
You are completely correct. there's no question that when the waterfall turns red that they are hitting the bid faster than the offers have a chance to. I don't trade the T&S. Its a supporting tool for me that's all. It doesn't carry any heavy weight for me personally because I need time for the bar to be painted anyway before I take a position. If I alluded to my feeling that the T&S is very helpful to me, I apologize
I don't know where you entered your position for the ride down. This is part of the difficulty I have with this. Can you point it out?
Also, I've read a lot about having rules in regards to trading. I was constantly breaking my own rules and ultimately lost a lot of money. I'm trying to turn that around. Do you have rules associated with this method of trading? What do you need to see take place to enter a trade? Can you show me?
I don't know if you are the person or not, but I learned a methodology very similar to what you have discussed. It's a little freaky because he used TOS for pivots, both weekly and daily and he uses many of the terms you have used in your posts. He has literally hundreds of videos on Youtube all winning trades without indicators and speaks constantly about professional money as well as some of the other comments you made. I'm wondering if you know who I'm speaking of? Or, is it you, or have you taken a course of his?
Isn't Time and Sales reading the tape, or are you referring to something else when you talk about the tape? I thought you viewed reading the tape as important.