Welcome to NexusFi: the best trading community on the planet, with over 150,000 members Sign Up Now for Free
Genuine reviews from real traders, not fake reviews from stealth vendors
Quality education from leading professional traders
We are a friendly, helpful, and positive community
We do not tolerate rude behavior, trolling, or vendors advertising in posts
We are here to help, just let us know what you need
You'll need to register in order to view the content of the threads and start contributing to our community. It's free for basic access, or support us by becoming an Elite Member -- see if you qualify for a discount below.
-- Big Mike, Site Administrator
(If you already have an account, login at the top of the page)
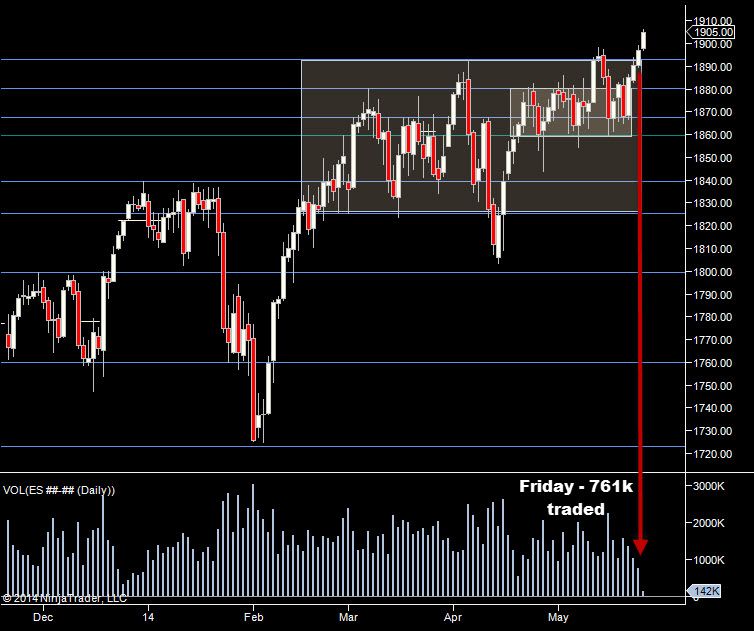
My apologies for Friday prep - there was/is a coup here in Thailand & the internet went off just as I was about to post it!
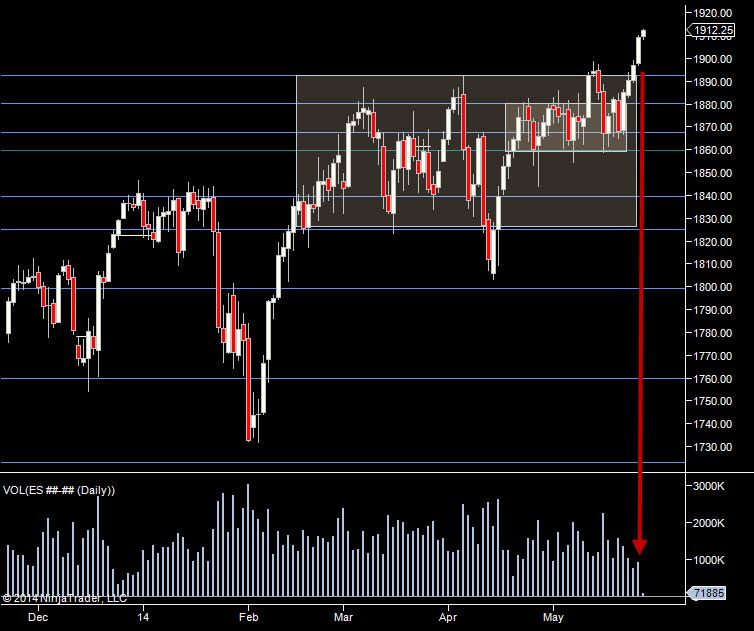
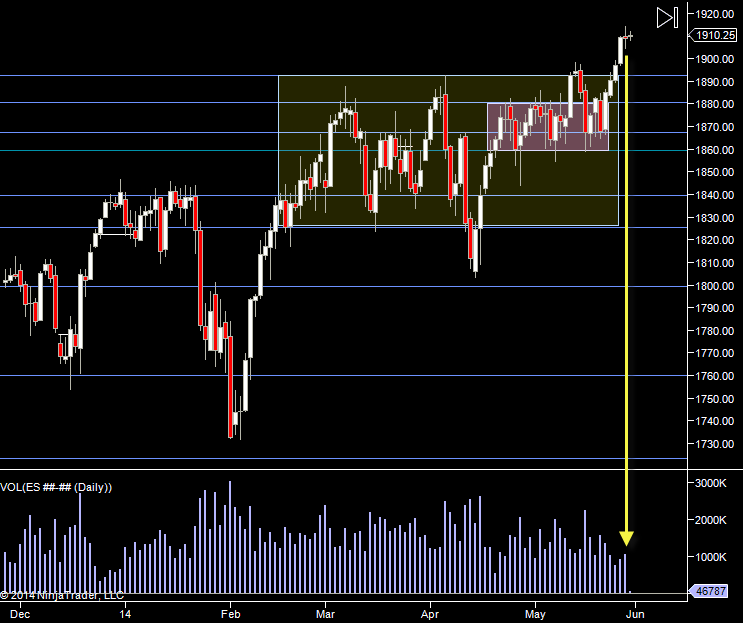
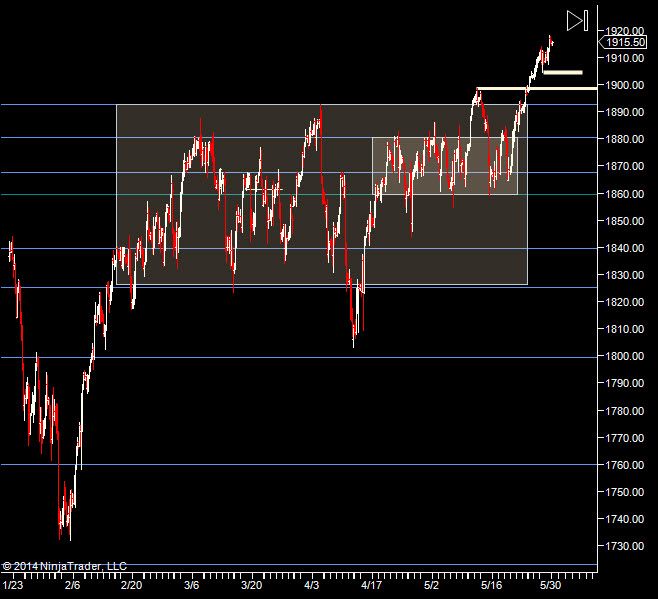
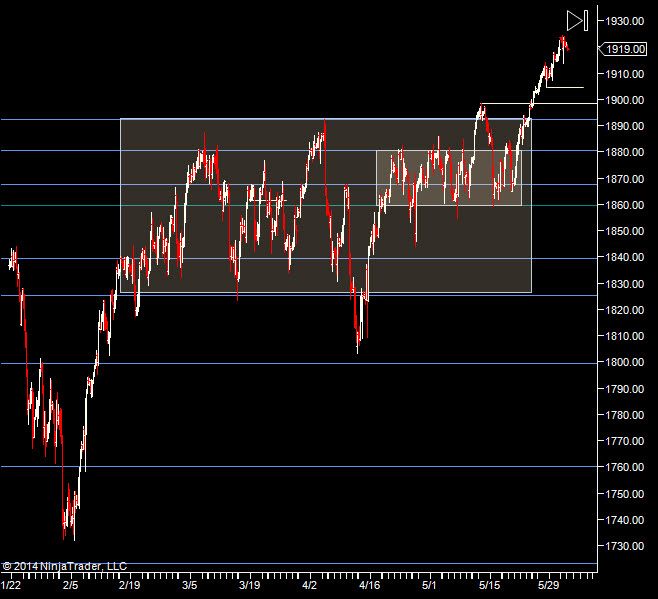
We popped the high on Friday but being the Friday preceding a holiday Monday - volume was really weak. In fact, just 761k traded. So a pop but a weak pop.
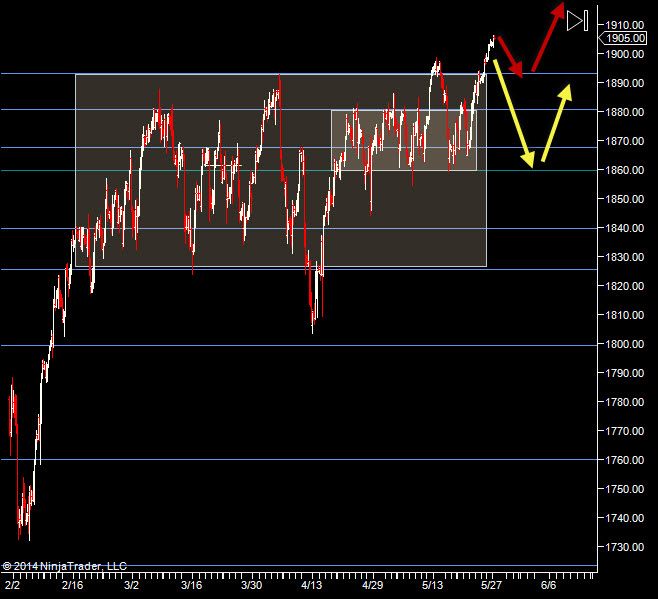
So two scenarios going into today - a retrace back to 92.50 would be a good stepping stone for continuation upwards. Breaking through that significantly will likely see sellers step in ans push us down towards 59.50.
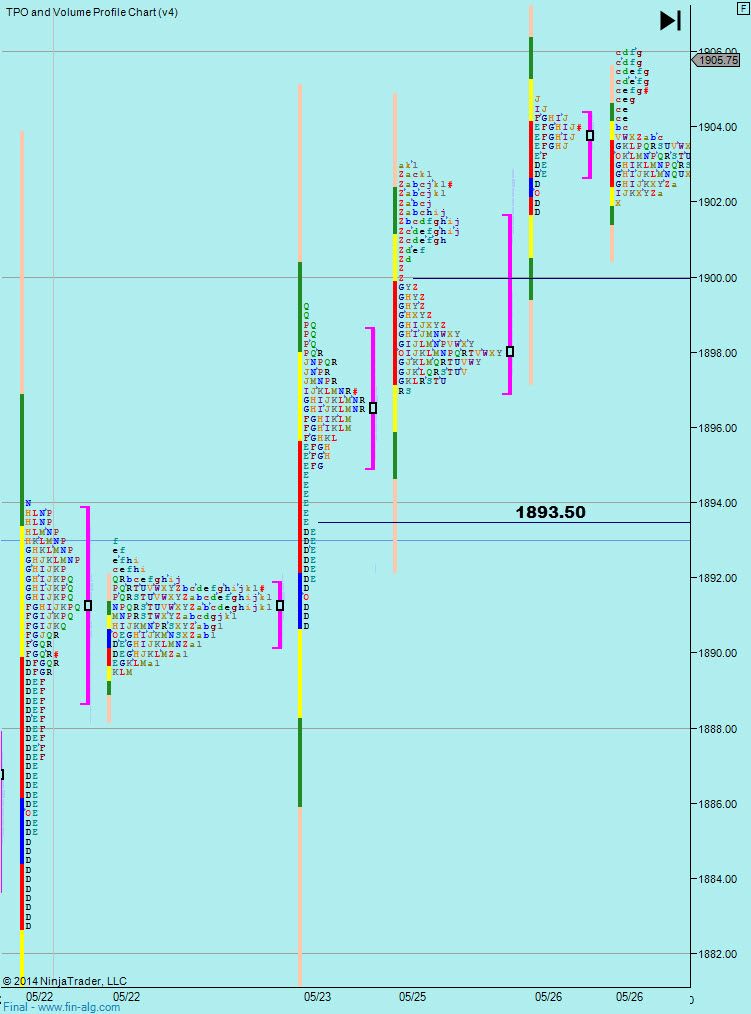
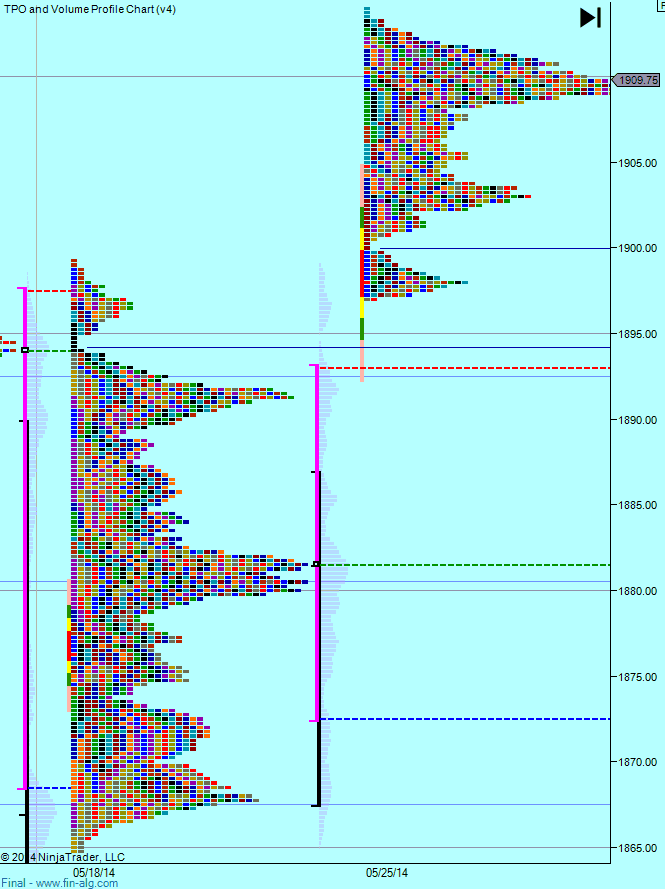
On the split profile - we can see a single print at 1900 and that could end up being a place buyers defend. I have it noted but think it's less likely. Below there is another single @ 93.50 - which gives a bit more weight to the 92.50 above. So we look for buyers 92.50->93.50.
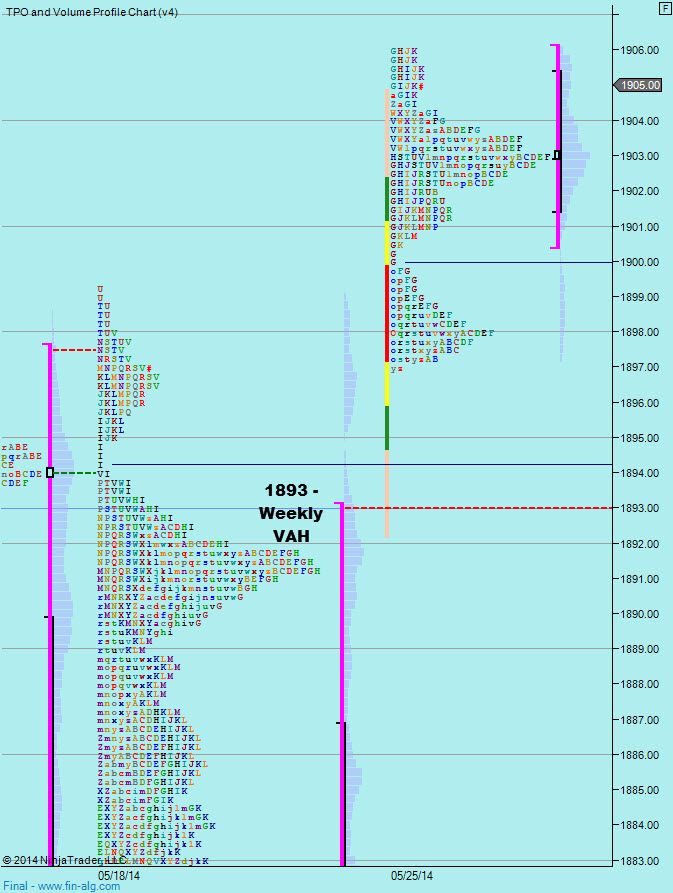
Last weeks value high is 93, so again that gives us a bit more weight to the 92.50-93.50 area. The top distribution on last weeks profile ends at 1889. So if we get through 1889, I'm expecting some acceleration.
So that's all I'm looking for today. Pullback to 1900 or 92.50-93.50. If 92.50-93.50 breaks, caution short to 1889 but expecting a decent move down if that breaks.
Weekly Numbers Range - 1864.75 -> 1899.25
Value 1873.50 -> 1893
S1 1874.74, R1 1909.25
Yesterday was a pretty lackluster day - we did move up some more but volume was only 960k. Maybe because there's not much interest up here and maybe because people took extra vacation after memorial day.
Right now, this is not a strong high.
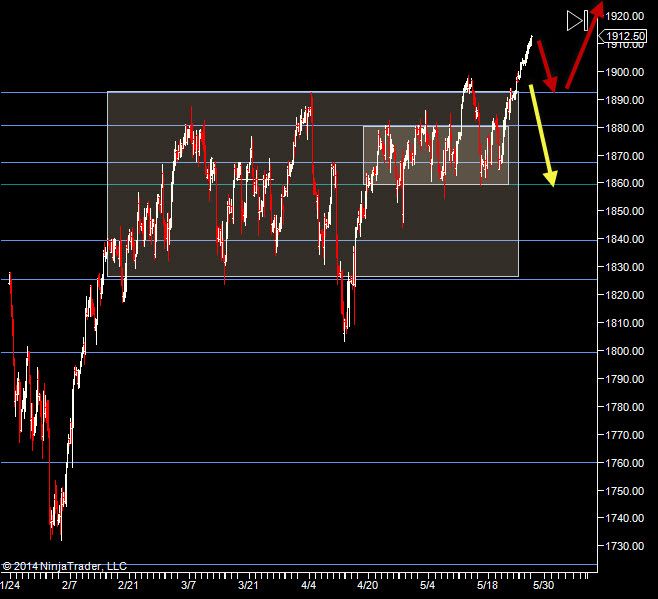
Going into today, I'm looking at the exact same things I was yesterday - a re-test of the range high or back to the old range...
"So that's all I'm looking for today. Pullback to 1900 or 92.50-93.50. If 92.50-93.50 breaks, caution short to 1889 but expecting a decent move down if that breaks."
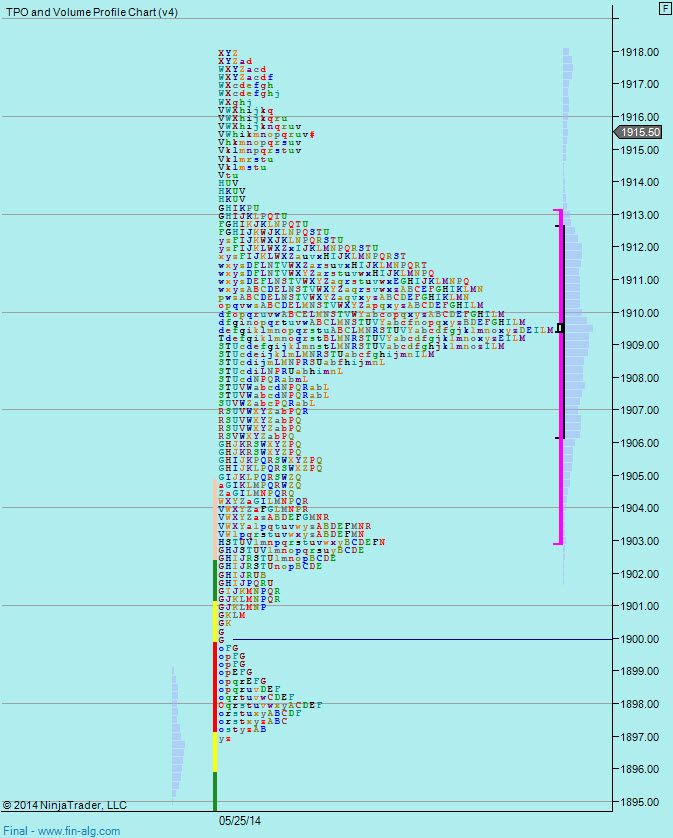
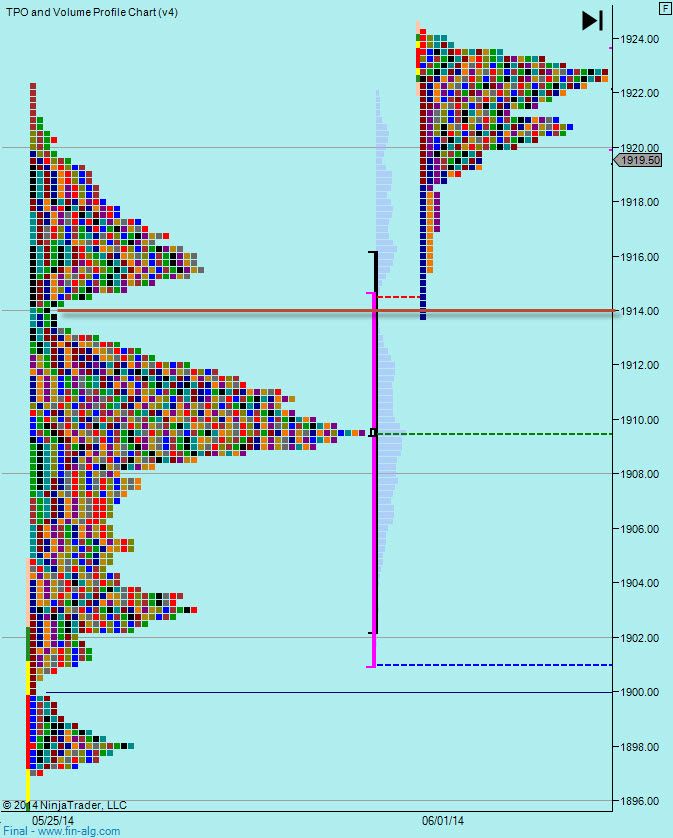
From a weekly profile perspective. We are really just confirming the 1900 level as the bottom of the distribution and
that makes it a stronger level going into today.
In addition to the above, also looking at yesterdays Value Area & Pit low for a pullback. Note that so far, the globex sessions has held at yesterdays VAH.
Obviously we are in areas we haven't traded before, so not much analysis today as there's not much history to play off.
Weekly Numbers
Range - 1897 -> 1913
Value 1901 -> 1910
S1 1874.74, R1 1909.25
Daily Numbers
Range - 1902 (globex) / 1903.50 -> 1910
Value - 1905.25 -> 1908.25
Globex - 1908.25 -> 1913
We pushed higher yesterday but ended up close to where we started. Tuesdays value area was significant yesterday but it was a low confidence day - certainly in the AM when I do my trading. Volume overall was still fairly low. Over the million mark but not by much.
We still haven't had a pullback to the old range and I still have that in mind...
"So that's all I'm looking for today. Pullback to 1900 or 92.50-93.50. If 92.50-93.50 breaks, caution short to 1889 but expecting a decent move down if that breaks."
This week though - those numbers haven't been very helpful.
As an aside - markets usually develop with a push up, consolidation, push up, consolidate again etc. Stronger trends tend to have more space between the consolidation areas, so there is no reason at all that we MUST test the old high. Still - if we pull back to the old high and them move up, we can still be leaving a "gap" between this range and the next one up. So a re-test does not mean "no space between consolidation areas".
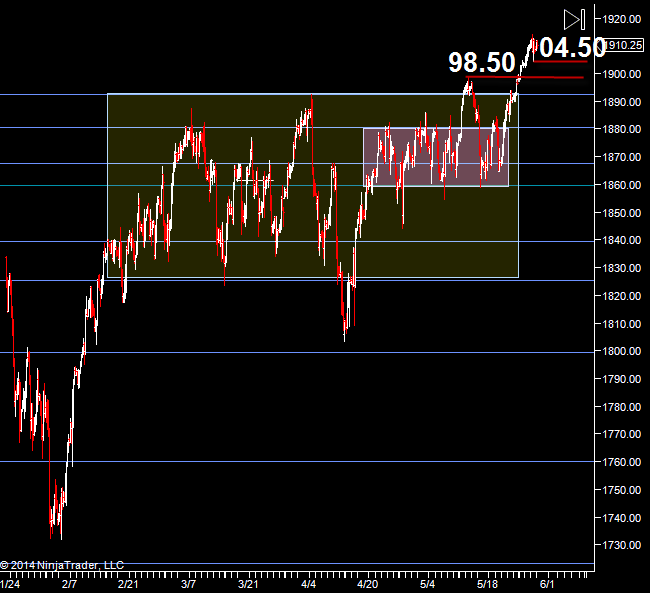
We do have a couple of higher prices we can look at for a re-test too. the low of yesterday - 04.50 and the old high 98.50. If we see buyers supporting either level, then it gives me a bit more confidence to lay into a long trade. As it is, we are on new ground and trading either way is lower confidence for me. Basically I want to see the market "lean on" something and react.
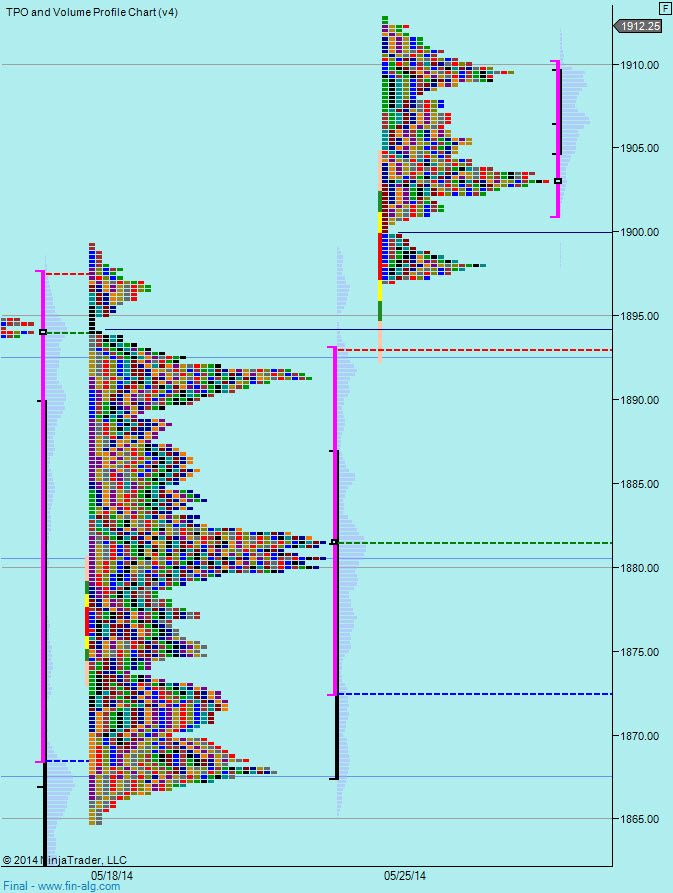
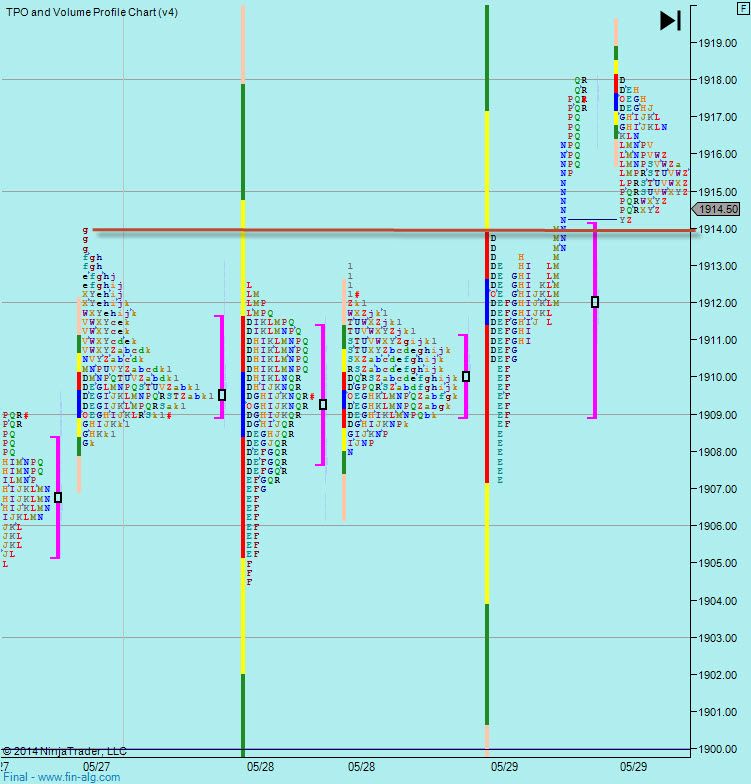
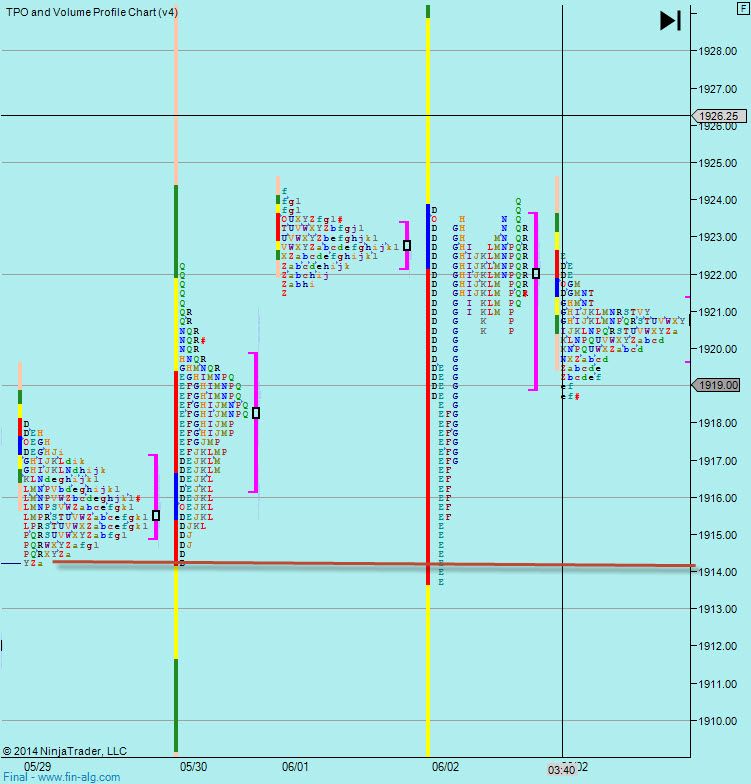
Weekly profile isn't telling us much - 1900 is still the single and below the upper distribution on the profile. So it's a level to watch.
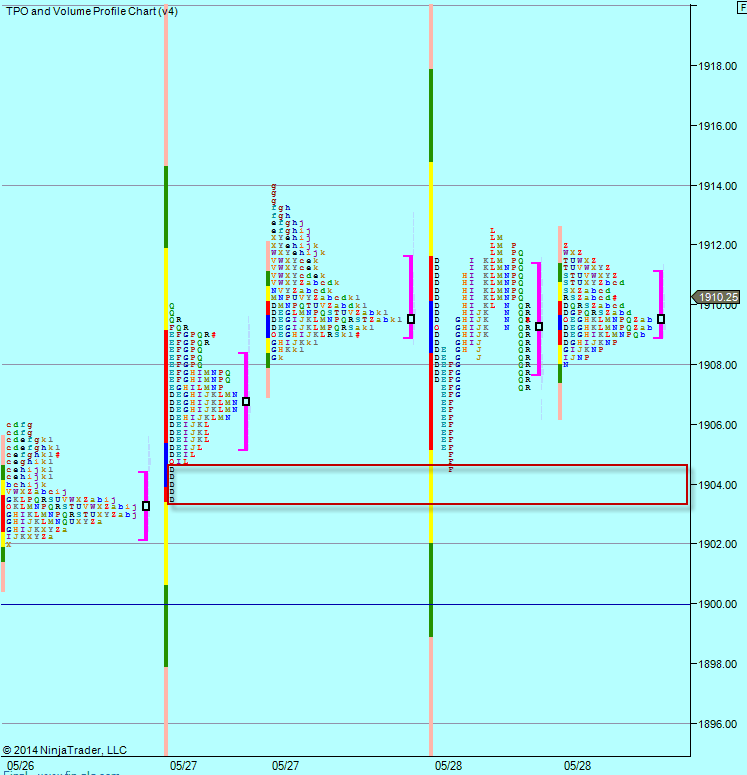
On the split profiles - we can see yesterdays pit session within Tuesdays pit/Wednesdays globex range. We can see potential support developing in 03.50-04.50 area based on Tuesdays/Wednesdays lows - but also we can see 12-14 as potential resistance. So first order of the day hopefullu is to break our of yesterdays range either way and see how buyers/sellers react.
It could well be another weak, choppy day. I'm realy not interested too much if we can't get to 1912 or 1904.
Weekly Numbers
Range - 1897 -> 1914
Value 1903.50 -> 1912
S1 1874.74, R1 1909.25
Daily Numbers
Range - 1904.50 -> 1912.50 (pit)/1914 (globex)
Value - 1907.75 -> 1911.25
Globex - 1908 -> 1912
1 - It is my Birthday
2 - This thread is a year old (plus 2 days I just noticed)
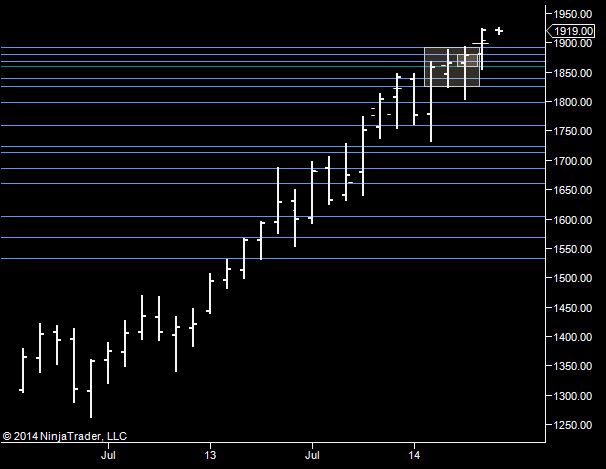
Still no real pullbacks since the breakout - onwards & upwards. This is the last trading day of March. We opened the month at 1879.50. There is a good chance we'll see window dressing today, that means a push up on the last day of the month. It also means that Monday is when we get to see how "real" this is by whether it collapses after a push up. Of course, anything could happen - so don't blindly go long because window-dressing is one of the possibilities.
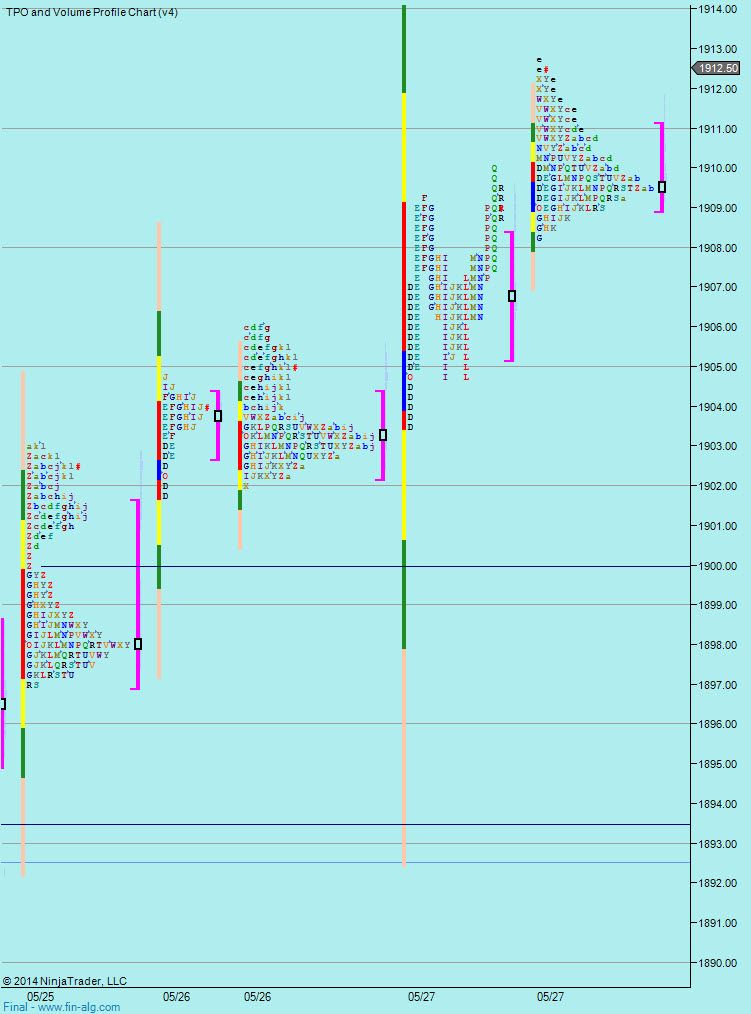
Value for the week tops out at 1913 - so we may see support as high as that. Not really much to infer from the weekly profile for me.
We can see the breakout point was around 1914. So we can expand the 1913 level above to the 1913-1914 area. Obviously that is holding right now (4:46 am EST) but will be a level of interest at the open - regardless of which side we actually open.
Note that this was a line in the sand yesterday and it was pretty painful going till we finally broke out of the 1904-1912/1914 range. I certainly didn't have the patience to hold on.
Weekly Numbers
Range - 1897 -> 1918
Value 1903.50 -> 1913
S1 1874.74, R1 1909.25
Daily Numbers
Range - 1907.25 -> 1918
Value - 1909 -> 1914
Globex - 1914.25 -> 1918
Another new month. We did have an end of month pop and so first order of this month is to see if we can hold that or if this push up has no strength and we drop back into the prior range.
We've still to have a decent pullback, which I guess is a sign of strength but volume has been pretty low since we got through 1900. So I'm still in low confidence mode and looking for us to come off a bit and to see if buyers are lurking below to defend these prices.
Last weeks profile shows a distribution above 1914. This was tested on Monday so is another potential line in the sand. Below that, I expect a grind to 1908.
On the split globex/pit profiles we can see that the 1914 area (1913.75-1914.25) has acted as support which confirms the 1914 level above.
So first order of the day, depending on how we open is any reaction off yesterdays VAL of 1919. If we move down from there, looking for buyers at 1914. To the upside we have the all time high and yesterdays VAH of 1923.50.
If recent history is anything to go buy, we won't get to the downside levels or stop at the upside levels! Still - that's what I look for...
Weekly Numbers
Range - 1897 -> 1922.25
Value 1901 -> 1913
S1 1809.25, R1 1928