Welcome to NexusFi: the best trading community on the planet, with over 150,000 members Sign Up Now for Free
Genuine reviews from real traders, not fake reviews from stealth vendors
Quality education from leading professional traders
We are a friendly, helpful, and positive community
We do not tolerate rude behavior, trolling, or vendors advertising in posts
We are here to help, just let us know what you need
You'll need to register in order to view the content of the threads and start contributing to our community. It's free for basic access, or support us by becoming an Elite Member -- see if you qualify for a discount below.
-- Big Mike, Site Administrator
(If you already have an account, login at the top of the page)
Back after my annual "7 day fast" - something I like to do every year to untangle all the spaghetti in my head and take the spaghetti sauce off my waist. I'm back feeling clear of mind and full of energy.
This is an early prep as there's a busy day ahead. Some of this is me catching up and reviewing what happened. A little hindsight analysis....
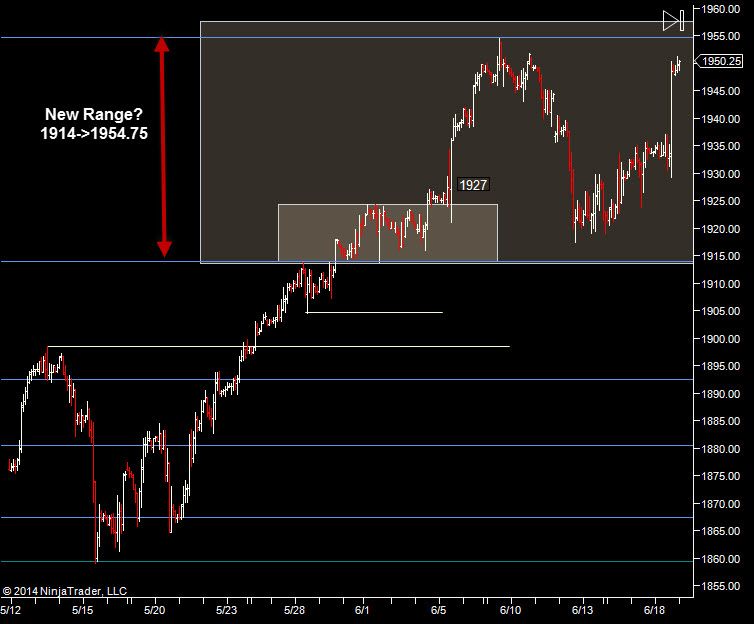
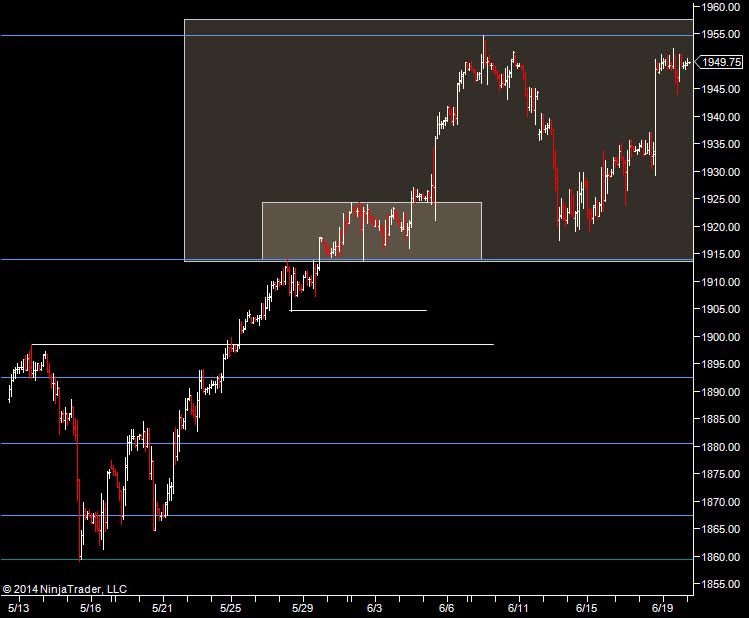
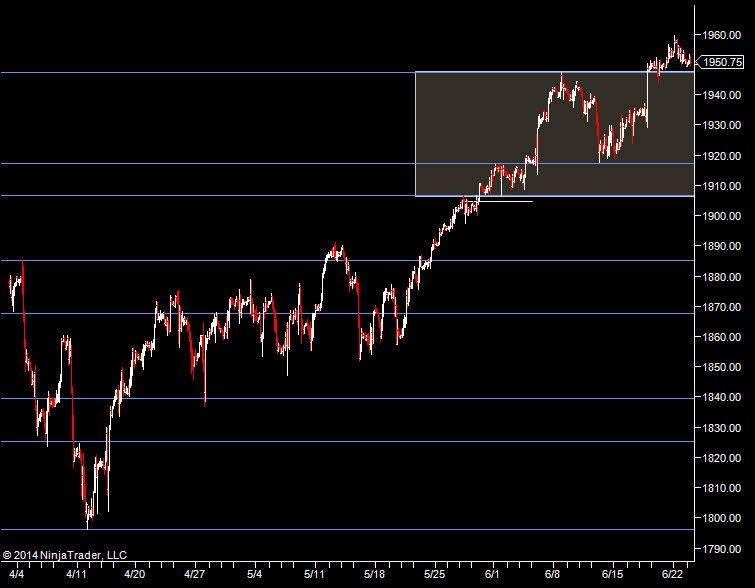
Back at the start of June we had a consolidation area after the big move up from 1850. As we were rising, I was talking about having little confidence until we had a test.
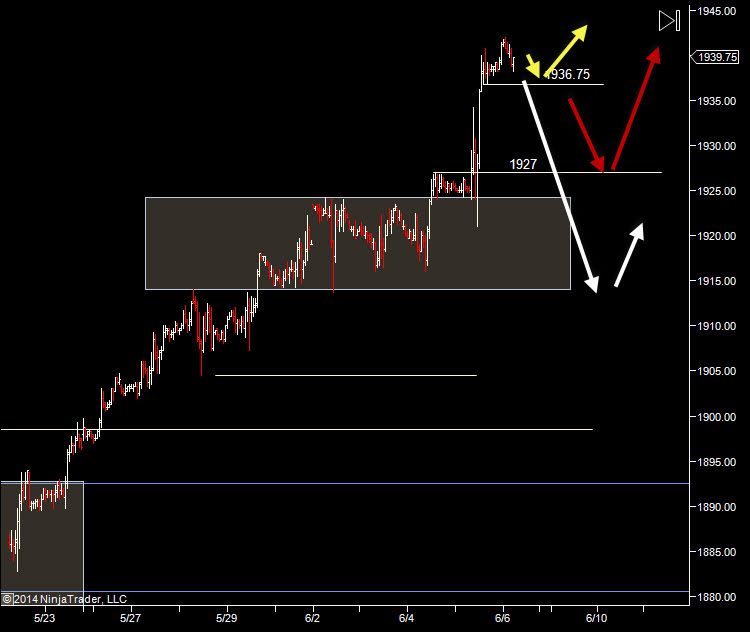
On 6th June we had these potential scenarios mapped out...
So the "white" scenario - a test of a consolidation area played out which means the subsequent move up should have been "higher confidence" for traders. It showed a clear line in the sand where buyers stepped up and defended these higher prices.
So now we are back towards the top. We have a potential new longer term range forming 1914-1954.75. Over the next few days, I'm looking for the high to fail or for us to extend the range a little and fall back into it. If that occurs, I'll be expecting to see 1914 again and to rotate around this area for a few weeks.
We could of course extend up and then "lean" on the old high to move higher still. I see that as lower probability.
Those are the the big picture scenarios I now have in mind.
I do also see potential for 1941.75 as a minor line in the sand going into today. That doesn't mean the highs will break and we'll trend up from here this, just that we might drop back to there before hitting the top of the range.
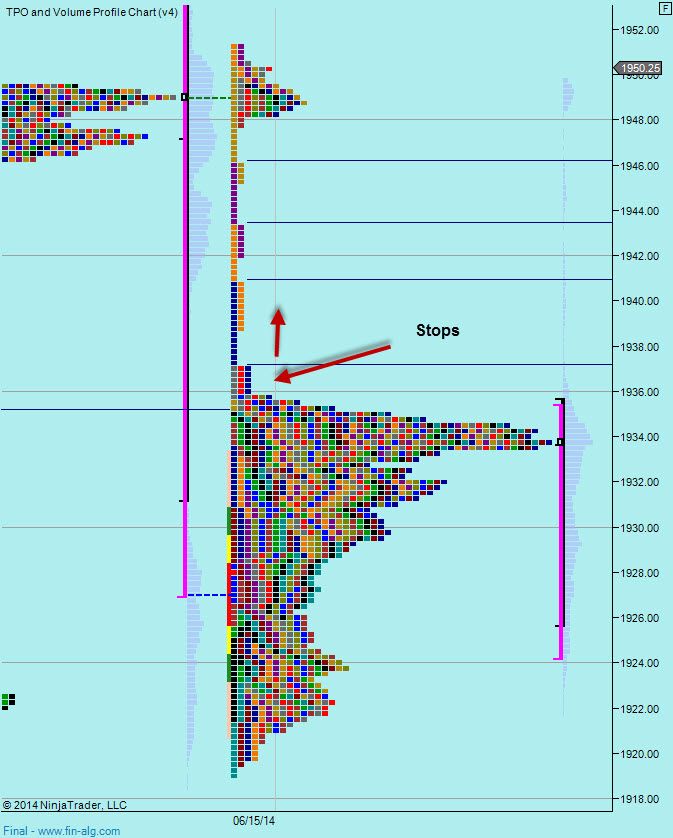
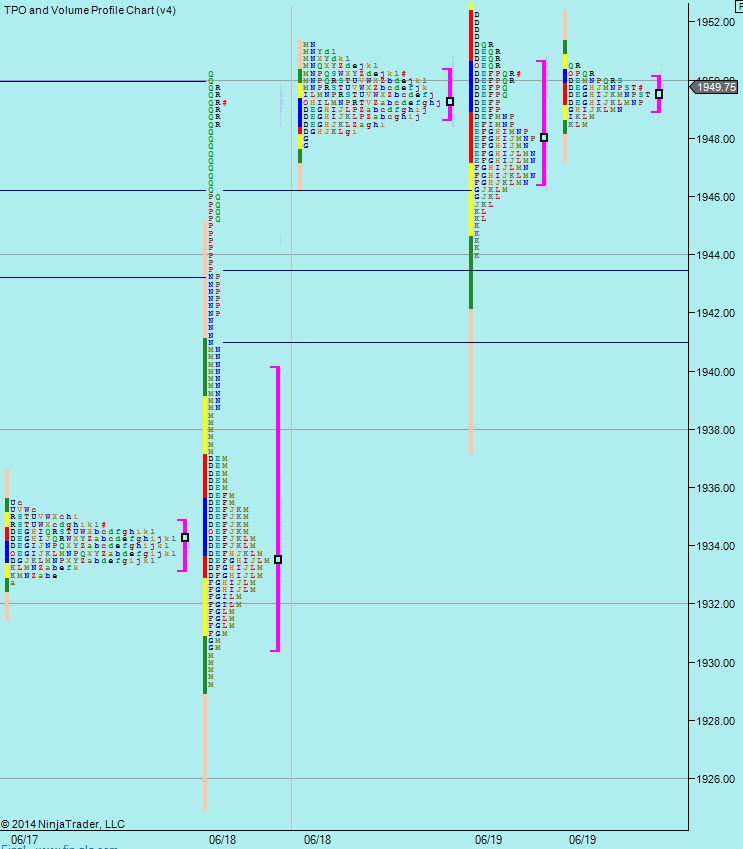
Yesterday we had a rather bizarre looking profile with a "flat top"around 1936. If you think about that top, it's an area where a lot of trading took place up to and including 1936 - meaning you have people positioned long & short there.
With a lot of positions around that top and no "taper" above, it means there's a lot of stops going to be sitting directly above that "flat top". I don't really believe that profiles must be completed to make them more 'gaussian' but I do think with a "flat top" like that, it follows that there are a lot of buy side liquidity sitting above that area in the form of shorts stops. That's buyers willing to buy at higher prices. So it makes sense when we see this sort of thing that the area will get tested and we'll see acceleration through if the shorts bail out. That's what initiated the first part of yesterdays late move up.
That doesn't help us much today but what does help us is that when we get back to that area (1935.75) there will be a good chance it will be defended as those shorts that got stopped out there will be licking their wounds and not wanting to short it again in a hurry.
This doesn't add much for me.
So - 1935.75 as a major line in the sand, 1941.75 as a minor line in the sand. Given yesterdays range, we have to be on the lookout for a trend day today (either way) but my bias is towards a test of the highs and back down again.
Weekly Numbers
Range - 1910 -> 1951.25
Value 1924.25 -> 1935.25
S1 --, R1 --
Daily Numbers
Range - 1929.25 -> 1950.25
Value - 1930.50 -> 1940
Globex - 1947.50-> 1951.25 (11pm EST)
We didn't really do much yesterday, so today we are basically in the same position long term as yesterday.
"So now we are back towards the top. We have a potential new longer term range forming 1914-1954.75. Over the next few days, I'm looking for the high to fail or for us to extend the range a little and fall back into it. If that occurs, I'll be expecting to see 1914 again and to rotate around this area for a few weeks.
We could of course extend up and then "lean" on the old high to move higher still. I see that as lower probability.
Those are the the big picture scenarios I now have in mind.
I do also see potential for 1941.75 as a minor line in the sand going into today. That doesn't mean the highs will break and we'll trend up from here this, just that we might drop back to there before hitting the top of the range."
and also...
"when we get back to that area (1935.75) there will be a good chance it will be defended as those shorts that got stopped out there will be licking their wounds and not wanting to short it again in a hurry."
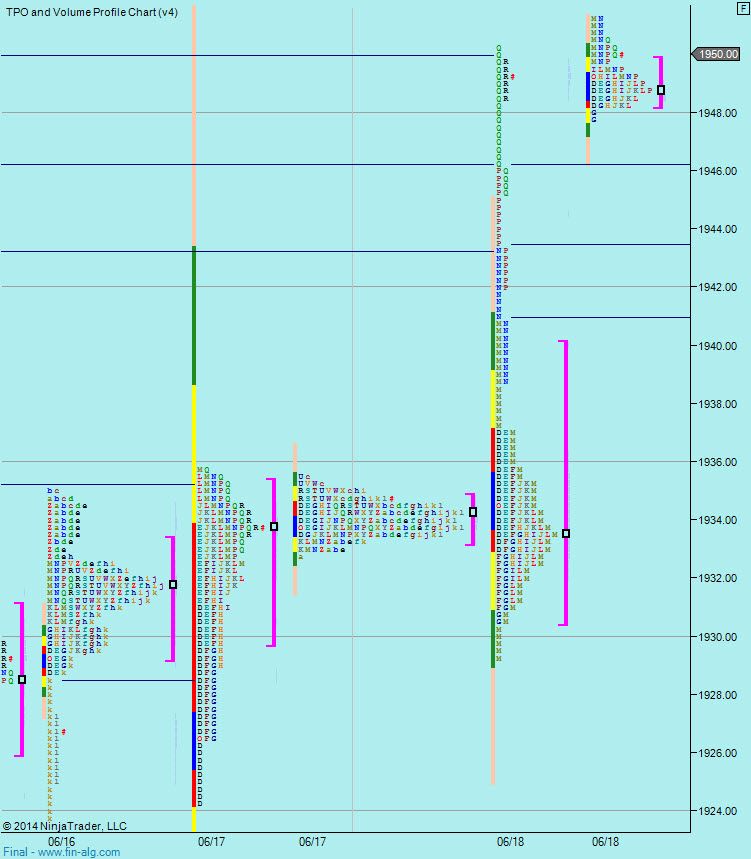
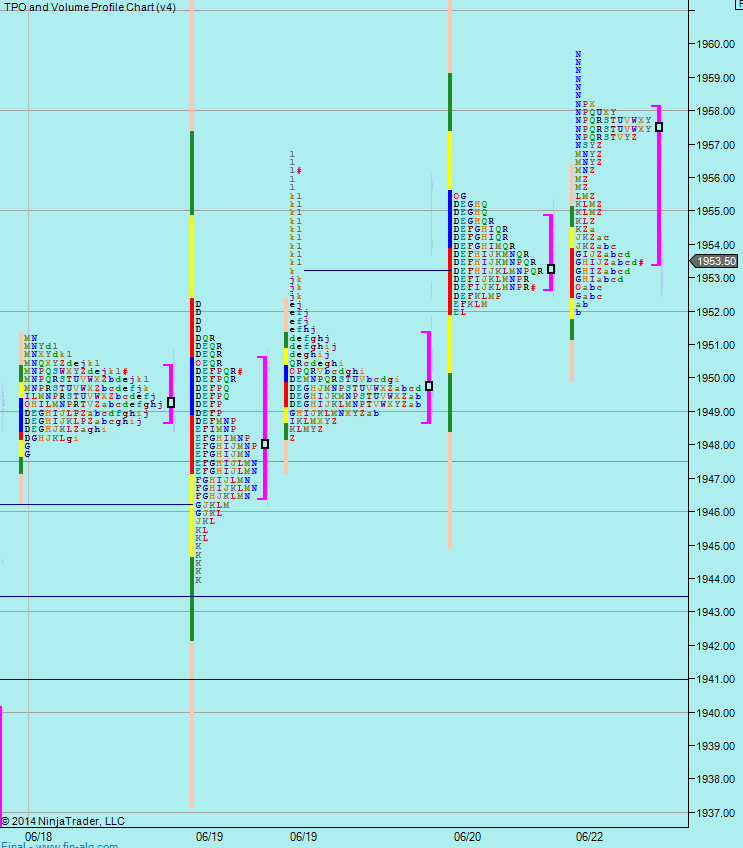
On the split session profile, we can see we are consolidating overnight within yesterdays range. VIX is around 10 so it could be another lackluster day. The more we consolidate here, the more power behind a break when it does occur. So watch for acceleration at the extremes of the range.
I am sure there will be headfakes but a real breakout should yield a decent move when it does occur.
Off the open, watch the value area/yesterdays range for a hold - that might give us a hint as to which way it wants to go - so an early move down to yesterdays value high that gets rejected could mean we are going for a test of the all time high.
Weekly Numbers
Range - 1919 -> 1952.25
Value 1919.25 -> 1939.75
S1 --, R1 --
Daily Numbers
Range - 1944 -> 1952.25
Value - 1946.50 -> 1950.50
Globex - 1948.25-> 1952.25
When i look at your 120 min. chart i have some difficulties to relate the location of your candlesticks with my chart which is also a 120 min. chart. See the differences (Yellow circles).
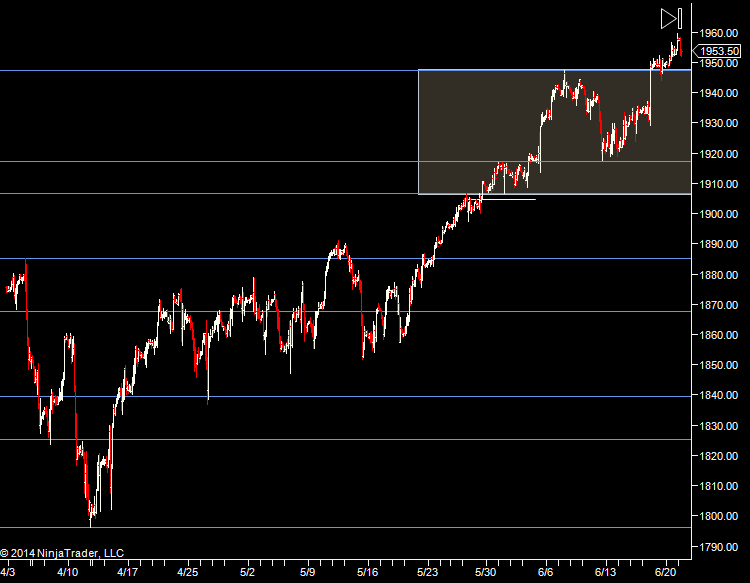
My apologies - I rolled my instruments incorrectly and the levels from last week were off, as was my analysis because of it. Long Term numbers below have been revised.
The major difference being that previously we were chopping around the old high and now we've effectively broken out of it and it's now acting as support.
We do still have potential for a multi-week range in the white box - 1906.50-1947.50. We have popped above and come back and tested that 47.50 high and held it. So now we need to watch to see if we move up from here or retest again. If we retest 47.50 and it fails - I see it going back to 1906.50.
So basically that's on my radar today - move up (either with or without a test of 47.50) or back into that range.
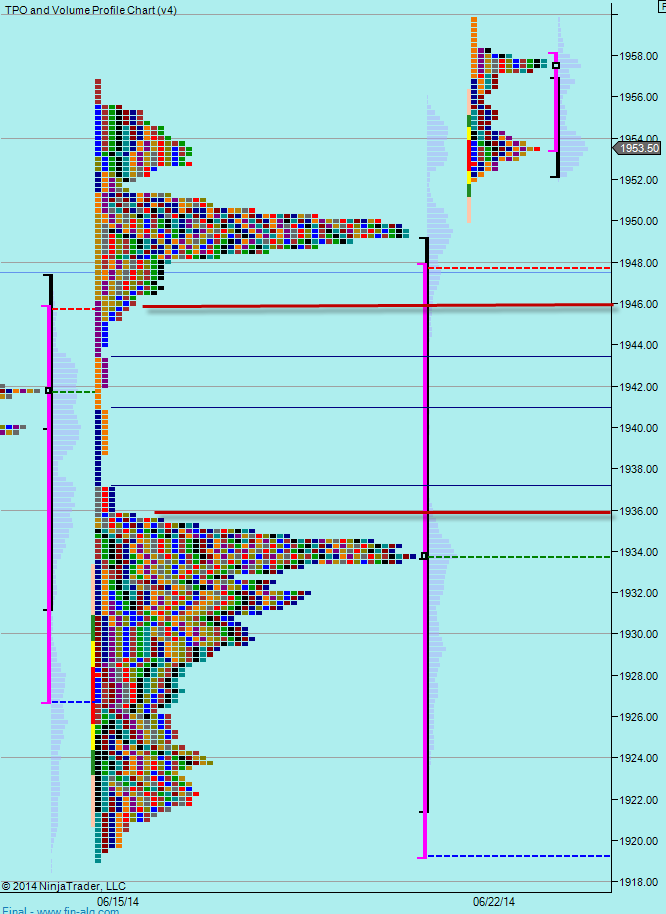
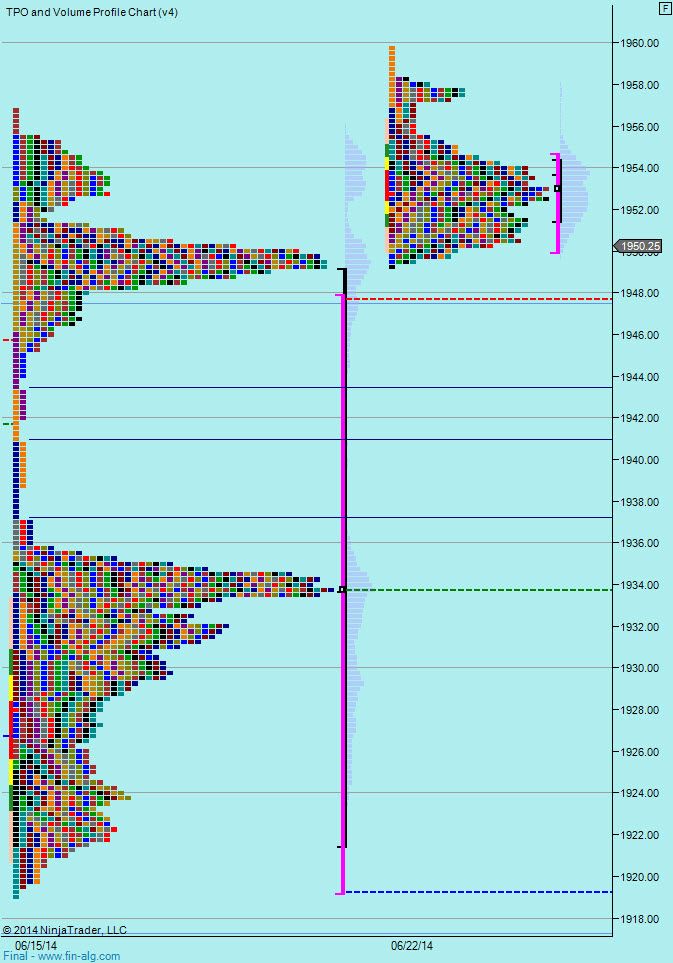
From the weekly profile we can see 2 distributions from last week and an area between 46 and 36 where very little trading took. So if we drop through 1946, we can expect a rapid move down to at least 1936. 1936 should hold at least for a bounce and then if it fails we'll start working our way down to 1920.
The split globex/pit profile shows what we all experienced at the tail end of last week - that slow range, it also re-iterates the lack of trading below 1946 and the chance of a stop run below it.
So first order of the day - see if we can make additional move up or come back and test 47.50. To the downside expect a break of 46 to see a run down to 36 for at least an initial bounce around 36. If that breaks, look for 20.
VIX very low, so of course, also a possibility of not much at all happening.
Weekly Numbers
Range - 1919 -> 1956.74
Value 1919.25 -> 1947.75
S1 1932.25, R1 1965
Daily Numbers
Range - 1948.25 -> 1956.75
Value - 1952.75 -> 1954.75
Globex - 1952-> 1959.75
Today - 1946, 1936
Long Term- 1947.50, 1917.25, 1906.50, 1867.50, 1839.50, 1825.25, 1796
If you have any questions about the products or services provided, please send me a Private Message or use the futures.io " Ask Me Anything" thread
Long term - still looking at the same scenario as yesterday.
"We do still have potential for a multi-week range in the white box - 1906.50-1947.50. We have popped above and come back and tested that 47.50 high and held it. So now we need to watch to see if we move up from here or retest again. If we retest 47.50 and it fails - I see it going back to 1906.50. "
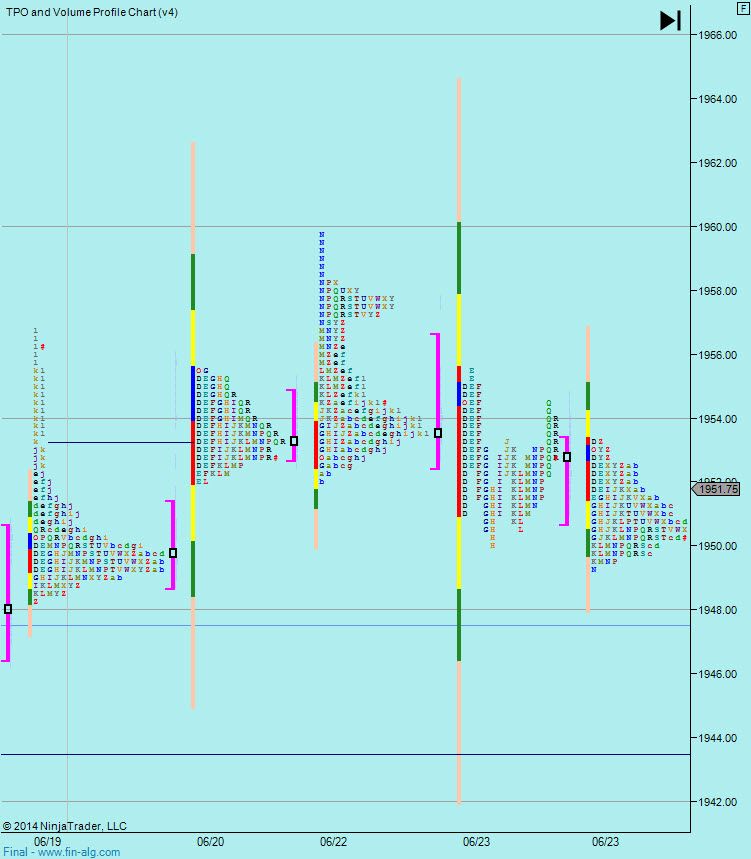
Yesterday we ranged around the upper distribution from last week. A small poke above but not enough to confirm additional upside. So comments from yesterday still hold.
"From the weekly profile we can see 2 distributions from last week and an area between 46 and 36 where very little trading took. So if we drop through 1946, we can expect a rapid move down to at least 1936. 1936 should hold at least for a bounce and then if it fails we'll start working our way down to 1920."
Yesterday we chopped around and didn't really show a strong reaction off of any level. We did briefly hold some levels from the overnight volume profile at the open but basically it was really chopping around and not leaning on anything specific from my a higher perspective. We did of course see some intraday levels hold but not in the way you could jump on a second entry and bite out of a trend.
I'm expecting more of the same until we look like we have a confirmation on a move back to the range or another leg up. A faders market.
Volume profile, lower timeframe charts, being able to gauge momentum stalling along with a quick finger on the exit button are your friends in this market for scalping within this action.
Weekly Numbers
Range - 1919 -> 1956.74
Value 1919.25 -> 1947.75
S1 1932.25, R1 1965
Daily Numbers
Range - 1950 -> 1959.75
Value - 1950.75-> 1953.25
Globex - 1949.25 -> 1953.25 (5am EST)
Today - 1946, 1936
Long Term- 1947.50, 1917.25, 1906.50, 1867.50, 1839.50, 1825.25, 1796
If you have any questions about the products or services provided, please send me a Private Message or use the futures.io " Ask Me Anything" thread