Welcome to NexusFi: the best trading community on the planet, with over 150,000 members Sign Up Now for Free
Genuine reviews from real traders, not fake reviews from stealth vendors
Quality education from leading professional traders
We are a friendly, helpful, and positive community
We do not tolerate rude behavior, trolling, or vendors advertising in posts
We are here to help, just let us know what you need
You'll need to register in order to view the content of the threads and start contributing to our community. It's free for basic access, or support us by becoming an Elite Member -- see if you qualify for a discount below.
-- Big Mike, Site Administrator
(If you already have an account, login at the top of the page)
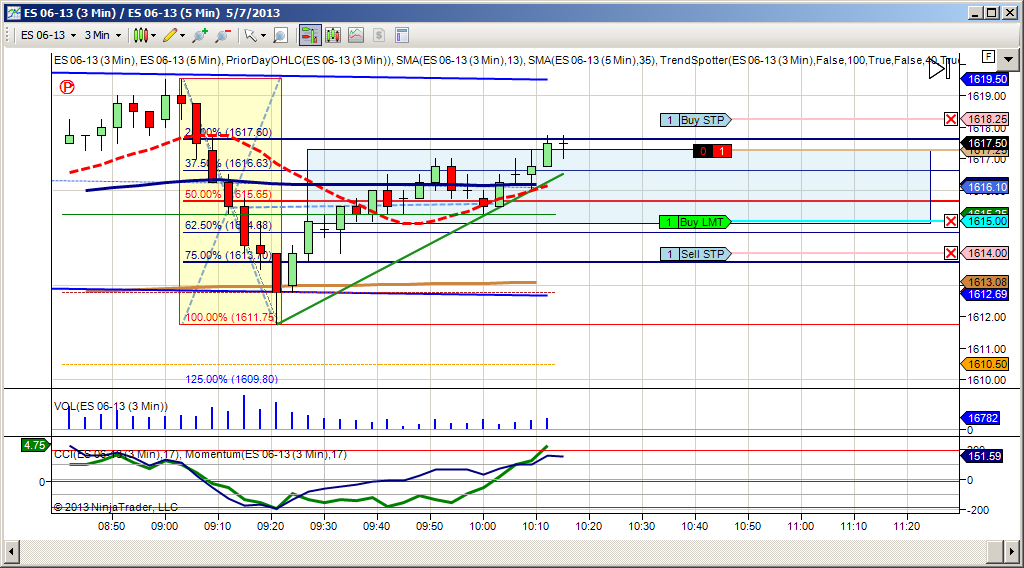
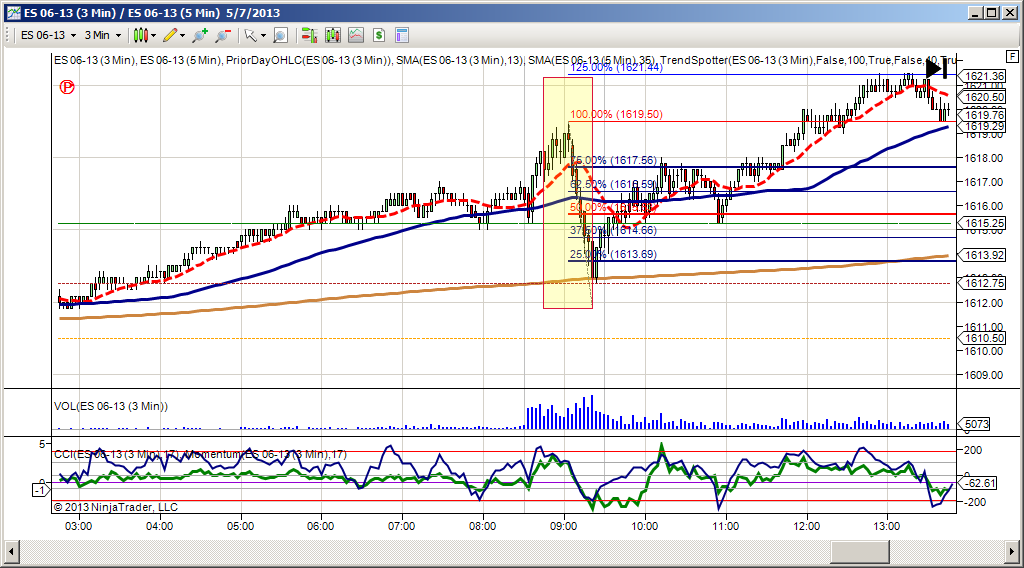
range bound day
yellow rectangel shows range and blue is the current middle of this choppy mess.
These are good days not to trade unless you have a range strategy and are only trading for a few ticks.
http://screencast.com/t/kUfk3f4T
Can you help answer these questions from other members on NexusFi?
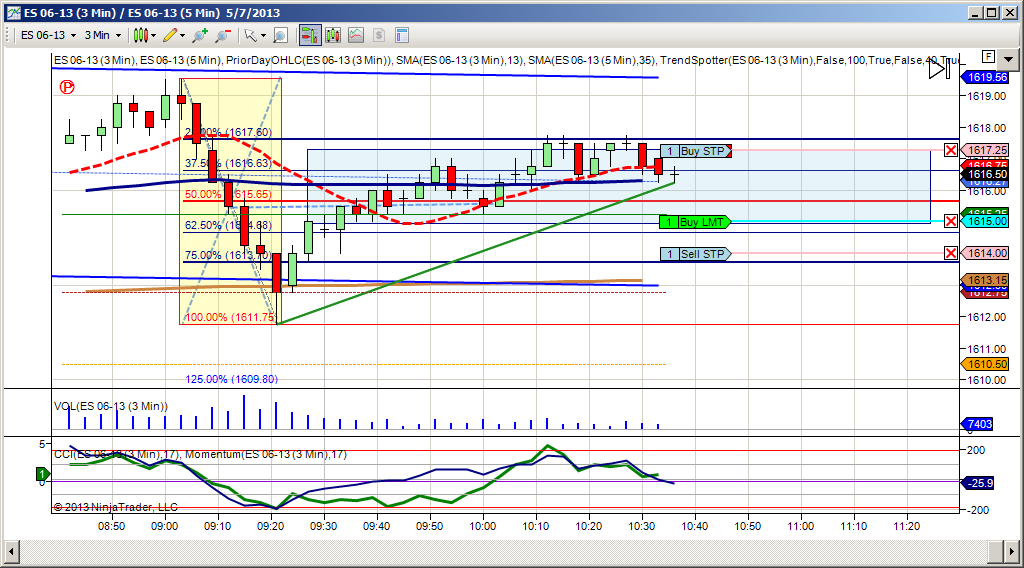
I've got 2 charts of today's /ES action. How would you project targets when entering long at today's PP (12,00) or at retrace to yesterday's high (15,25)? The entry point isn't the issue here, but the profit targets (possibly at 127,2 or 161,8 levels).
How would you draw your fib extensions when trading /ES, according to it's usual behaviour? I'm looking for a way to consistently project the same levels that everybody else does, thus finding reasonable targets for intraday trades. Black arrows in the pictures attached are there to show the two ways of I would measure the move. But I'm noob in fibs, so I'd like to have a professional fib drawer opinion here.
Here I'm using the retracement tool but with values 127,2 and 161,8. I'm using the last swing hi to the last swing low to project resistance levels. What do you think of this approach? It seemed to work with this chart pretty well today with price touching 127,2 almost to the tick. But again, I have no knowledge of using fibs, so which do you guys think is working best with /ES intraday trading and also for projecting in the daily chart (using either 24h session or just cash session)? BTW, all the charts embedded here are 24 hour. And again this is probably the wrong thread to discuss this issue, so might have to make a new one.
This defineately is the right place to post your questions and thanks.
I'll give a stab at answering them (though its getting late and I must go to bed soon, so it may be tomorrow.
Bear in mind that there is no one way. Different people and will use a different approach and usually adapt their approach for the conditioins of the day. (For example Ken highlighted that on a narrow day he finds anchoring on the overnight session high and low works well).
As you asked, one needs a consistent approach. However, it would best be phased as a consistent approach for each set of conditions. For example, it should be something that you can phrase if this and this then use this approach.
Just so I'm clear, you are looking for how to establish intraday targets - is that correct?
Do you have a time frame or point frame you want to trade? (For myself, as an example, I want a minimum of a 6pt proift potential, and the time frame is within the RTH session.)
- Yes, I'm looking for probable target levels for intraday trades. I trade no breakouts, just reversals and pullbacks to trendline.
- Usually, I do not take trades outside RTH, but still use 24h charts. I like to take bigger intraday swings, trading 3-4 contracts, usually scaling out and trailing my last 1-2 contracts as far as it goes. So my target 3 would be at least 5-6 points. However, most of the time I can't see profit taking levels others use and I have to use price action and divergence signals to find the top. So I'm looking for some extra levels (fibs or other) to give me more confidence to see in advance where my trailing targets might be. Of course, it's a matter of context too.
I've been using market profile levels too, but not lately. Something like IB (first 60 min of RTH) and IB highs and lows. What do you think of those? I also use pivots set to floor and ONH + ONL levels.
an edit to the question on anchoring Fibs:
you asked for a "Fib expert" (I'm not going to say I am an expert in Fibs I use retracements and extensions as one tool)
you asked for targets others would get to (this is different than asking for the correct estimate).
I will attempt to give you my answer later but by all means start a new thread as well and check for other threads specially on Fibs
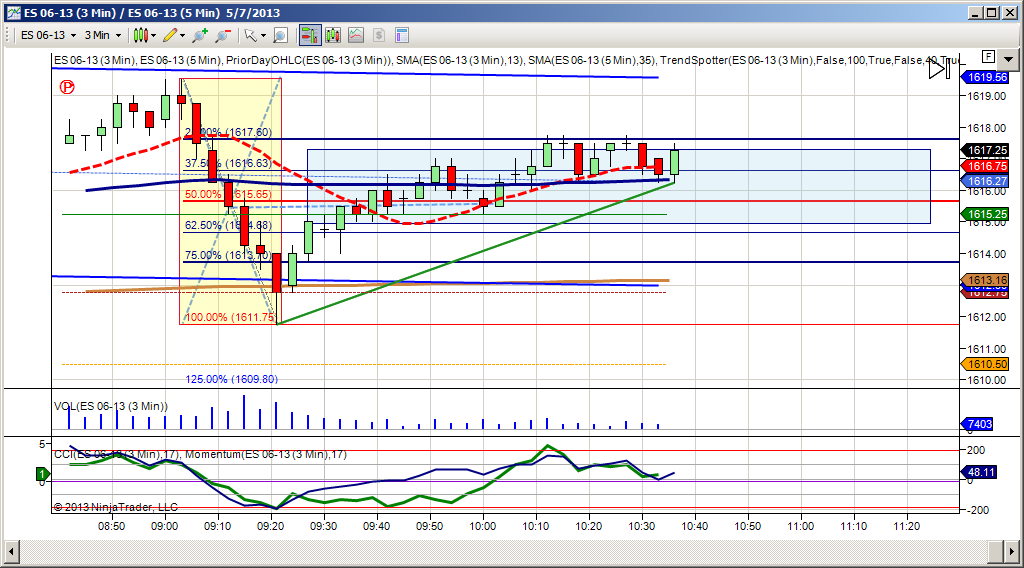
Ok here are my thoughts. The rule of thumb I would suggest is the last completed move relevant to the time frame you are trading. So if you are trading a section of the RTH then that is the relevant timeframe. This means your second anchoring of your first chart (it helps if you show the times and label the prices you use for your anchoring on the chart.)
In the first part I show how I would do it on the move you indicated. I do it with my ratios and then show measuring the idea of the result - to learn how "your beast behaves". https://screencast.com/t/Whn3whiS
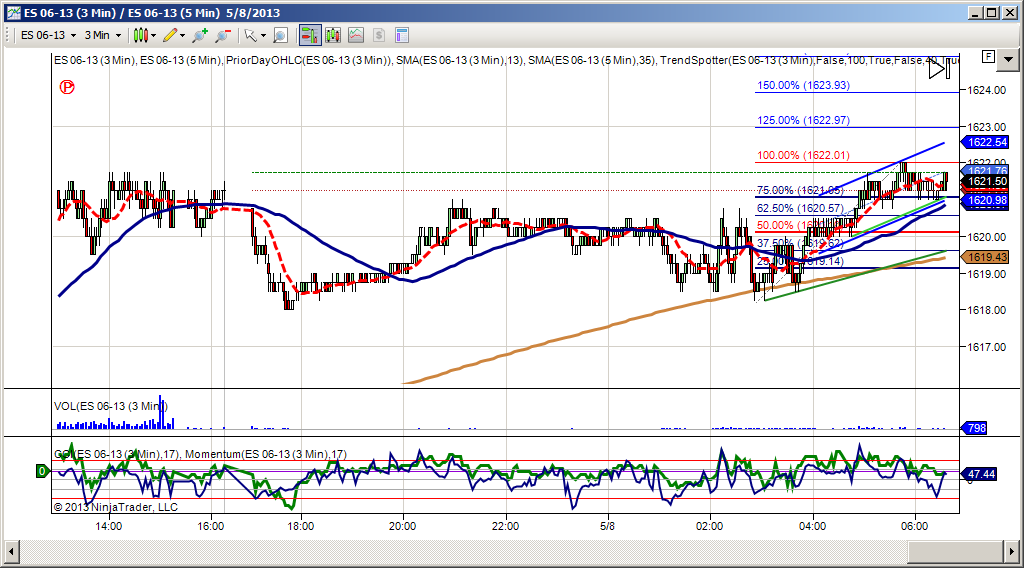
In the second part I discuss using other measurements of estimation to give you a confirmation, Such as the prior day's range (i.e. 10pts) or 3 day moving average of the ranges (i.e. 9.50 pts). So you can add 10 or 9.5pts to the low 1611.75 @ 9:25 ==> 1622.25 or 1621.25. The high was 1621.75. https://screencast.com/t/yadWGuZvuaiK
I've decided to give up on my uncombine.
I haven't realized how much time the posting takes and its cluttering this thread.
Just answering Jussi was an hour, so adding in uncombine stuff is too much.
If I decide to re-start I'll put it separately.