Welcome to NexusFi: the best trading community on the planet, with over 150,000 members Sign Up Now for Free
Genuine reviews from real traders, not fake reviews from stealth vendors
Quality education from leading professional traders
We are a friendly, helpful, and positive community
We do not tolerate rude behavior, trolling, or vendors advertising in posts
We are here to help, just let us know what you need
You'll need to register in order to view the content of the threads and start contributing to our community. It's free for basic access, or support us by becoming an Elite Member -- see if you qualify for a discount below.
-- Big Mike, Site Administrator
(If you already have an account, login at the top of the page)
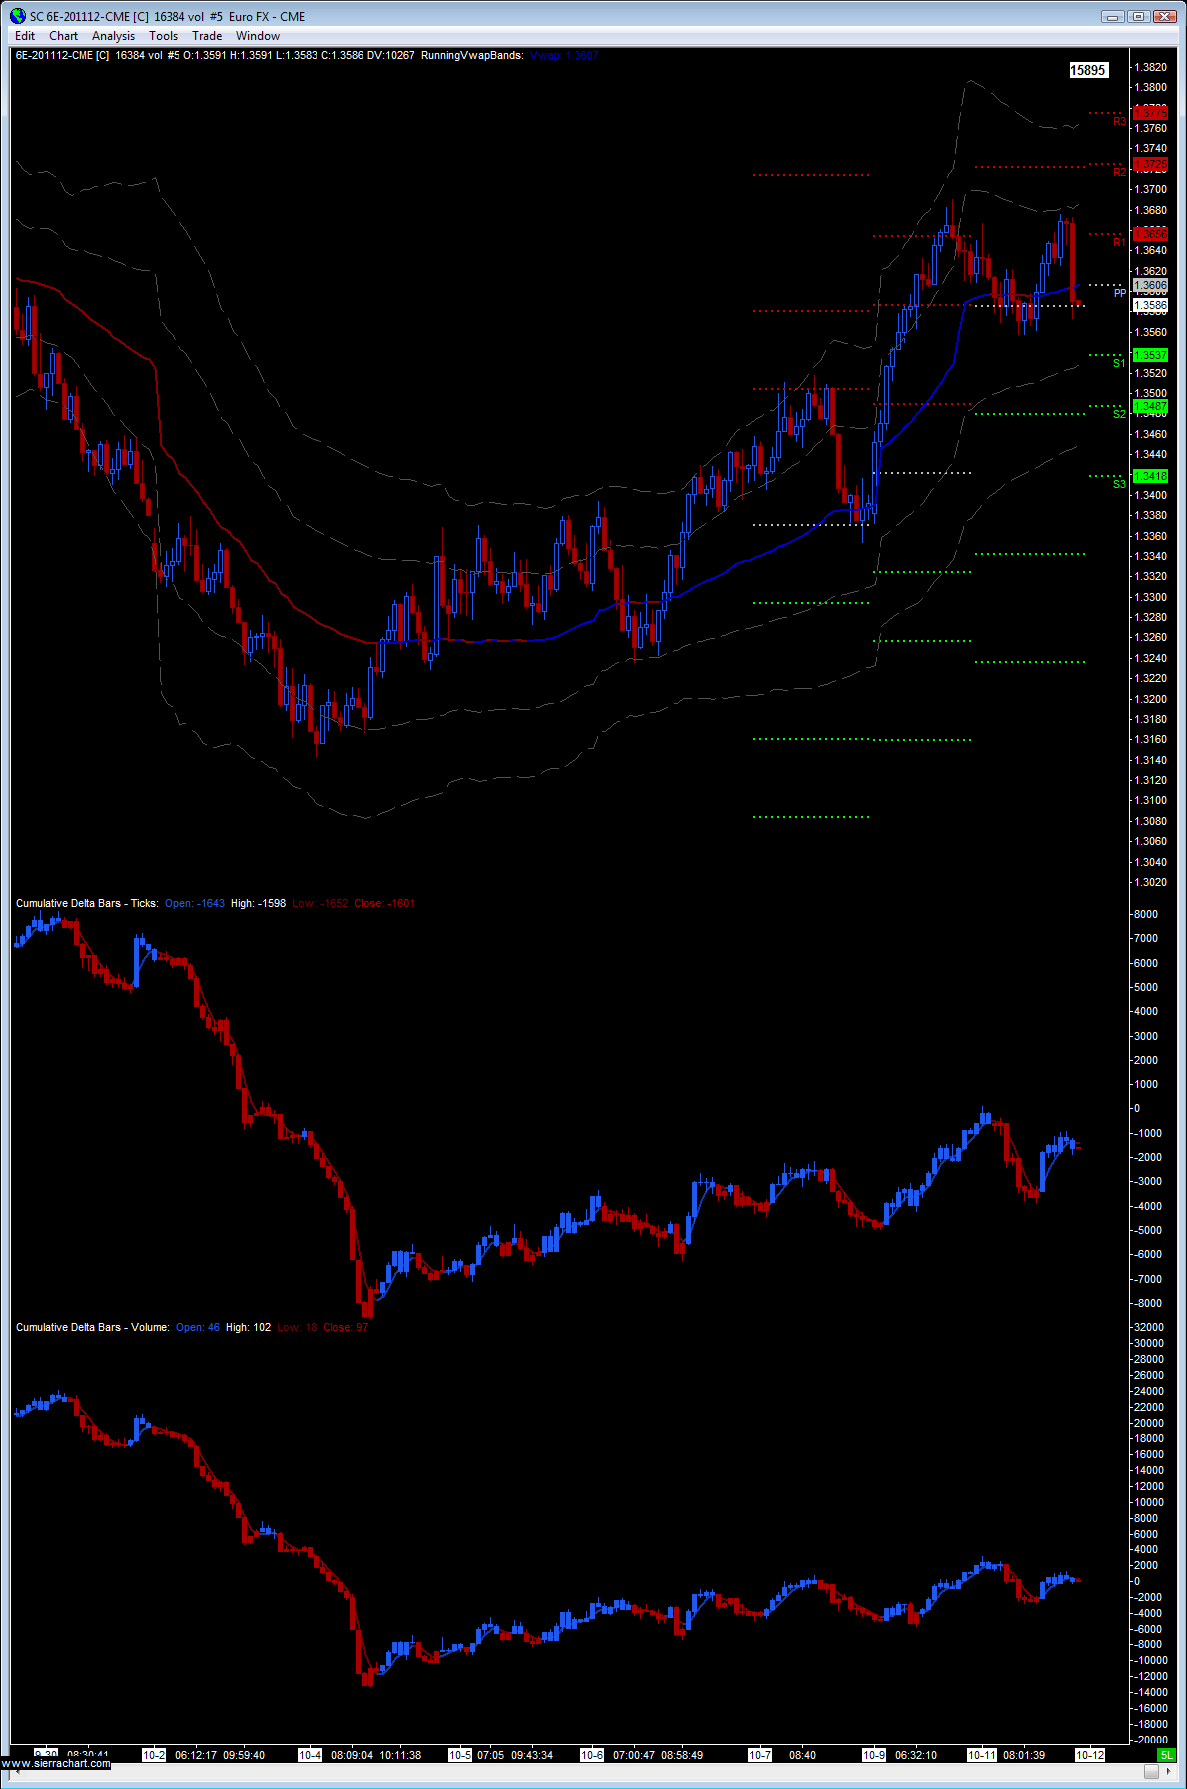
Typo correction--actual average entry price was 1.3672. Took another 1/8th risk off during the Asia-Pacific trade for 30 pips at 1.3608. Except for an AB pattern on the 200 tick spot currency chart between 5pm & 8pm and another around 8pm EST no real interruption in the down trend so far . Presently 1.35855. Still hoping for sparks at 1.3525. ETA again to add--excitement at 1.3525 if price breaks through what appears to be bids materializing around 1.3585 (**2nd screen shot)
Consolidation (may back off 0.05M 1/8 stop to see if 1.3600 resistance holds since above that the 15EMA on the 1800 tick chart is going to more or less coincide with what is the Murry Math 4/8 line on the 200 tick chart, hopefully providing some additional resistance):
Edited to add: flat just after 11PM EST when price broke upward through MM 4/8 on 200 tick chart. Won't touch it now until I know whether it's consolidating or beginning a new upward trend (i.e., until bottom of first retrace in an uptrend). In any event it's likely going to bounce around the pivot (PP on the charts) until London opens & it's time to pack it in for the night.
You can see one bar of 16384 volume (nothing magic about this figure) equals nearly the entire daily range, at end of session/after hour session.
With today's sideways movement, I simply shift most of what I said earlier to tomorrow. I think we will see 3500. Seeing 3200 by end of week is harder now simply due to time. If the bulls want to take charge, we need to see a close above 3700.
It is a multi-session VWAP, not a rolling (continuous) VWAP. I am not the author of this code as I am still a newbie in Sierra Chart. I did recently code a rolling (continuous) + multi-session VWAP for MultiCharts, but it still needs to be tested.
For my charts in this thread, it is Sierra Chart, and this indicator describes it as a multi-session VWAP with a configurable number of 'days back'. For the daily chart (1d) I am using 20 session VWAP. For the smaller charts I am using a 2 session VWAP. In both cases, I tell the indicator to not reset the average on a new session.
I am surprised by how they are defending 3570-80 area so much, so far it rockets right out of that area. This last test especially, where price was moving forcefully down into the 70's, then now has bounced almost straight back up. That is 100 ticks down, then 100 ticks back up in short order.
If that continues then we could definitely see 3725 today, and I think 3800 is even within reach.