Welcome to NexusFi: the best trading community on the planet, with over 150,000 members Sign Up Now for Free
Genuine reviews from real traders, not fake reviews from stealth vendors
Quality education from leading professional traders
We are a friendly, helpful, and positive community
We do not tolerate rude behavior, trolling, or vendors advertising in posts
We are here to help, just let us know what you need
You'll need to register in order to view the content of the threads and start contributing to our community. It's free for basic access, or support us by becoming an Elite Member -- see if you qualify for a discount below.
-- Big Mike, Site Administrator
(If you already have an account, login at the top of the page)
Broker: Advantage, Trading Technologies, OptionsCity, IQ Feed
Trading: CL, NG
Posts: 1,038 since Jul 2010
Thanks Given: 1,713
Thanks Received: 3,863
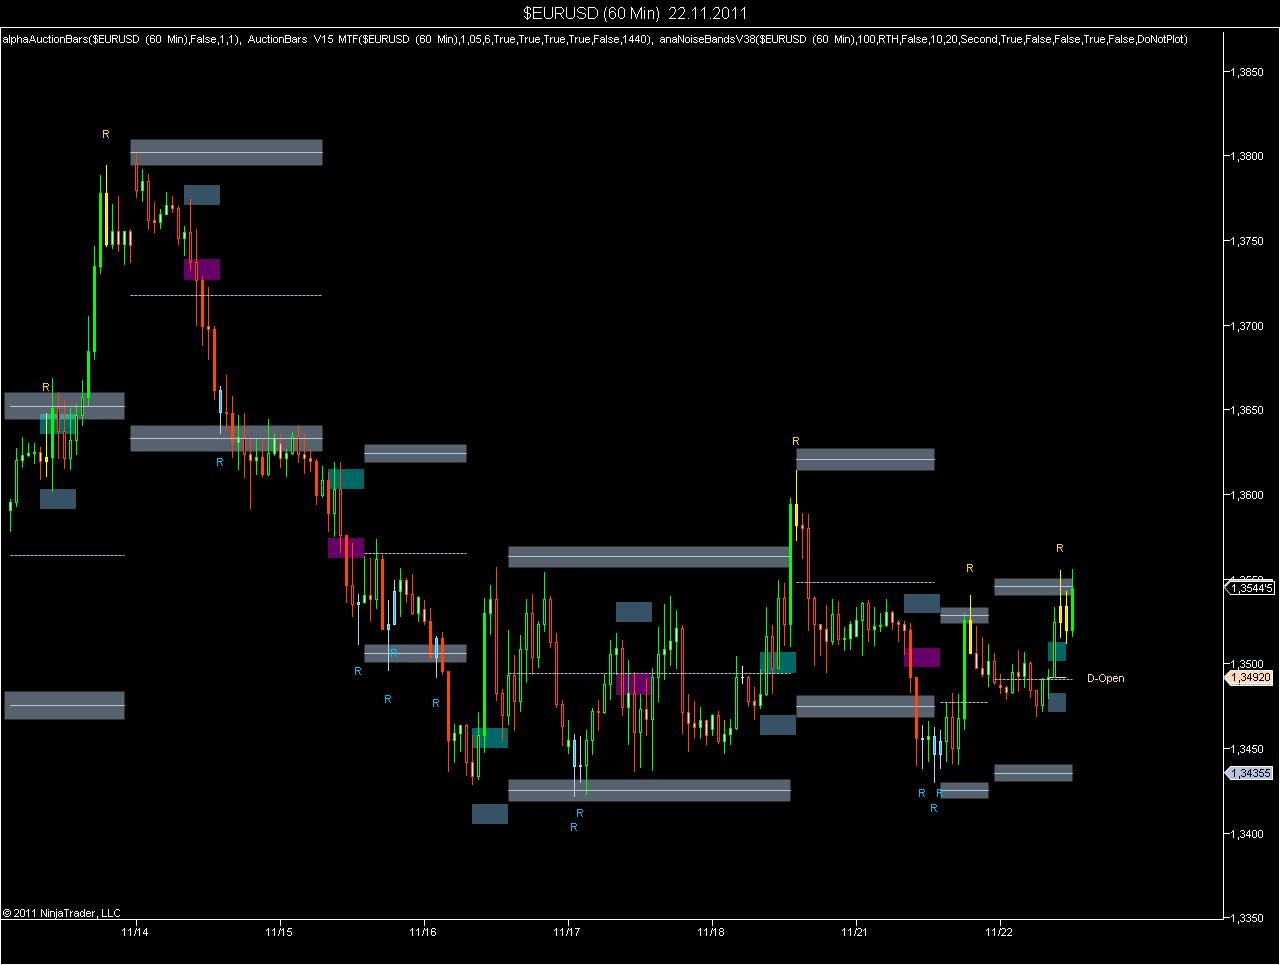
Seems like price is having a hard time getting past the 1.3440 area which is a high volume ledge. But if and when it does, a re-test of Oct.'s low seems like an obvious target. Market made it half way back from the high on 11/11 and completely lost it's momentum. Pretty amazing trading session today.
Yup , pretty nice today . If I recall correctly , the past few thanksgiving days (or maybe black friday) saw some sneaky volatile price moves so next week might be sleepy until its quiet on thursday and the turkeys trading for the banks push price where they want it .
I go through different time frames like 1H 30M 15M.
Where are daily HLC?
Zone with closes H/L's, battlefields
Numbers that are - in a nonscientific statistical way relevant for my 6E- like 00, 12 22 32 42 50 72 (dont ask why)
Fibs
My eyes
And then the best arguments are winning and do form the cocktail.
In this case it is about yesterdays HL levels. But thats not the main reason.
I do use strict criteria, as the levels are auto-plotting on my charts. But my levels are pretty close to yours,
both for the 240-min chart and the 5-min chart. So we mainly agree on loacting support and resistance.
For EURUSD my 5-min chart shows support at 3460 and resistance at 3533. The lower end of the range was not tested. This shows that the bears are weak, and that the bulls are currently controlling the market.
The indicator also identified a number of reversals as can be seen from the chart. There is a little breakout occurring which reflects some pressure to the upside, it looks like a cup and handle pattern right now, but it could also be a bull trap, as Europe has noon time. The New York opne will be a different chapter.