Welcome to NexusFi: the best trading community on the planet, with over 150,000 members Sign Up Now for Free
Genuine reviews from real traders, not fake reviews from stealth vendors
Quality education from leading professional traders
We are a friendly, helpful, and positive community
We do not tolerate rude behavior, trolling, or vendors advertising in posts
We are here to help, just let us know what you need
You'll need to register in order to view the content of the threads and start contributing to our community. It's free for basic access, or support us by becoming an Elite Member -- see if you qualify for a discount below.
-- Big Mike, Site Administrator
(If you already have an account, login at the top of the page)
I am an active member of this behavioral site. Every week I have sentiment data for the important markets. One aspect is that buyers will step in when the sentiment is very bad. But as always in trading one argument is not enough. And it is different for institutional and private investors (they separate them). They use other arguments too, to complete the picture. I don't post an example as it is copyright material. But maybe they have a demo sample. It can be found on Bloomberg too.
It does work quite well. (Not for me. as I am a very short term trader). My benefit is that the data that I deliver every week are in a database (my sentix). So I can compare my sentiment charts over some years with the other traders. This gives me an alert when my bias is very different from the market, and I can think about it. (I am too bearish in gold). And I can learn something.
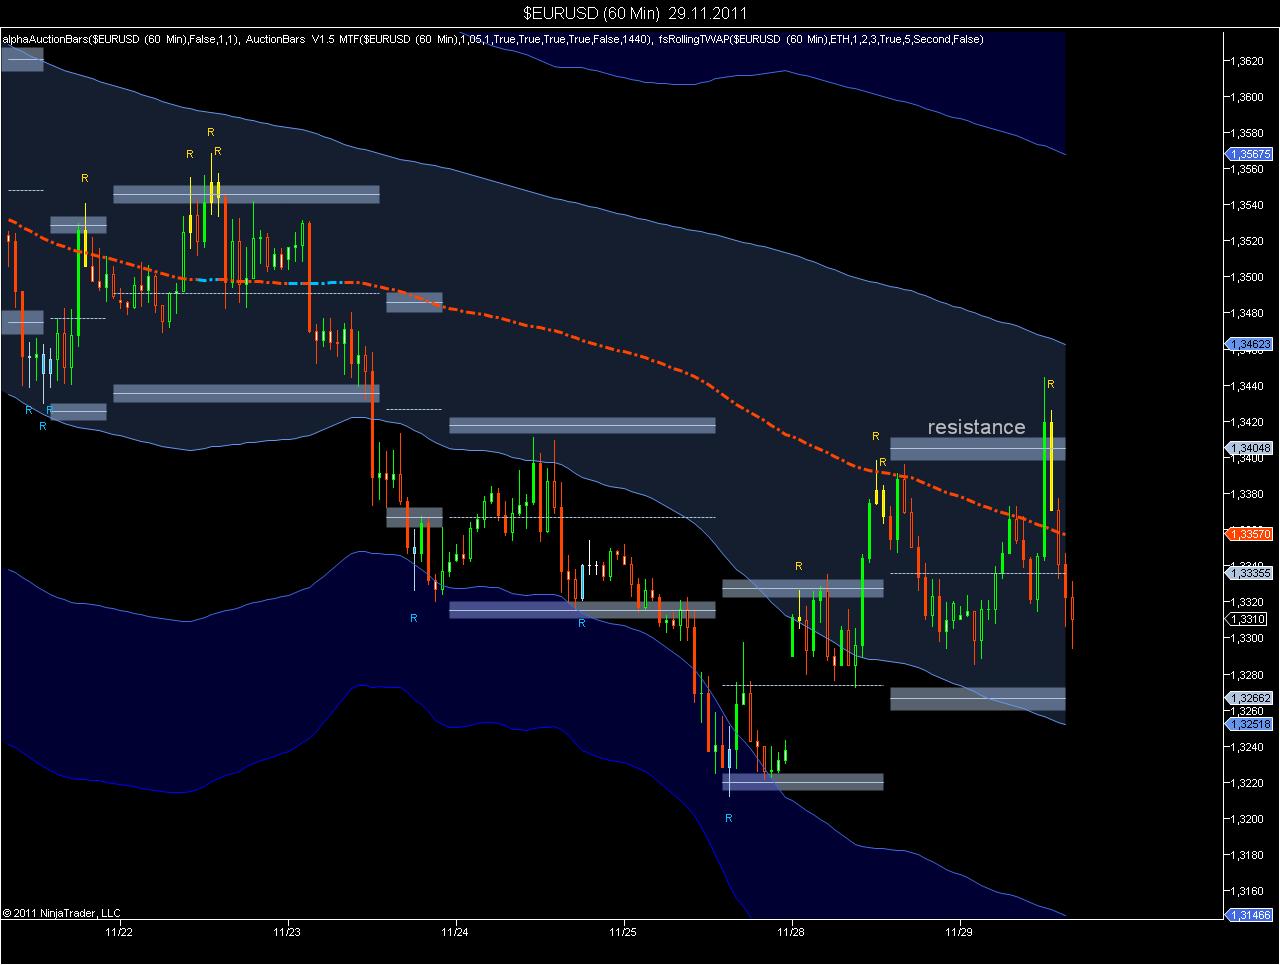
After the Italian auction Euro was sitting below the 3372 resistance, while Italian 10y were falling and CHF dropped... They did wait... And they stopped after the move at the 3432 res.
P.S.: The reversal this morning by the tick at Monday open. Nice how things work (sometimes).
This is not the large picture for the EURUSD, just an intermediate one.
My FOREX data has no historical volume information, and even if it had some volume information I would not trust it. For that reason I use the time-weighted average price (TWAP) instead of the volume-weighted average price (VWAP) for all FOREX instruments.
The chart below shows a rolling 5-day TWAP, which clearly declines, meaning that the trend is down. You can see how price snaps back, once it touches the 2 standard deviation bands and how price has retraced from the TWAP yesterday.
The ranges are auction ranges calculated from session bars. The chart loads one session bar for the Asian, the European and the US session each and uses that information to calculate the ranges. The ranges in turn are used to establish reversal bars, which should be seen in the context of the rolling TWAP.
Cant open your attachment . Januarys low is 3000 area , I just ride along with the heavier traffic . Im in the south bound lane but if I see it getting heavier in the northbound Ill switch lanes .
Weeeeeeeeeee Fed, ECB, Central Banks of Canada, England, Japan, and Switzerland Announce Joint Action to Boost Liquidity, Addressing Pressures in Global Money Markets (story developing)


 . Januarys low is 3000 area , I just ride along with the heavier traffic . Im in the south bound lane but if I see it getting heavier in the northbound Ill switch lanes .
