Welcome to NexusFi: the best trading community on the planet, with over 150,000 members Sign Up Now for Free
Genuine reviews from real traders, not fake reviews from stealth vendors
Quality education from leading professional traders
We are a friendly, helpful, and positive community
We do not tolerate rude behavior, trolling, or vendors advertising in posts
We are here to help, just let us know what you need
You'll need to register in order to view the content of the threads and start contributing to our community. It's free for basic access, or support us by becoming an Elite Member -- see if you qualify for a discount below.
-- Big Mike, Site Administrator
(If you already have an account, login at the top of the page)
Keep it going with this thread, there's some great ideas around.
Here is my 5 min chart of the week for ES, 1 long and 2 shorts valid entries: after a break out of the noise band, wait for a pull back and surf the wave
Sorry fat tails. This attachment should do the job. It is cl for 10-21-2011. I agree breakouts levels with ACD come late and whipsaws can be quite a bit. Hopefully, i will refine ACD method to avoid these.
Regarding 10-20-2011 chart, I understand when price pulls back into OR after A down per MF rules , one should sit on hands and watch. My question was 2 folds a) is there a way to determine that selling is done at 84.22 after A down and one should be looking for longs. Price moved from 84.22 to 85.73 ( OR low), that's a 1.53 ticks move. Per ACD , one should not try long after A down but rather be looking for shorts on bounces. I tried couple of shorts on the move up but got stopped out 3 times.
2) 2nd part, at what point, one should stop shorting. Per ACD, price had to go above OR high of 86.72 for A down set up to be over. I try to use conservative approach. I try to stop shorting after A down, if price moves back into OR lows even by couple of ticks. In terms of context, 30 days number line was also giving clues that major sell off is not in cards yet as trend is quite strong .
I guess , I am trying to identify other set ups as per ACD there was only 1 key trading set up- A short after A down.
CORRECTION; The high of the day for 10-21-2011 was 88.88 ( not 89.90 my chart notes show). Thus price pulled back from 88.80 to 88.07- OR high after A up. Long was taken but did not give much and price came down into OR.
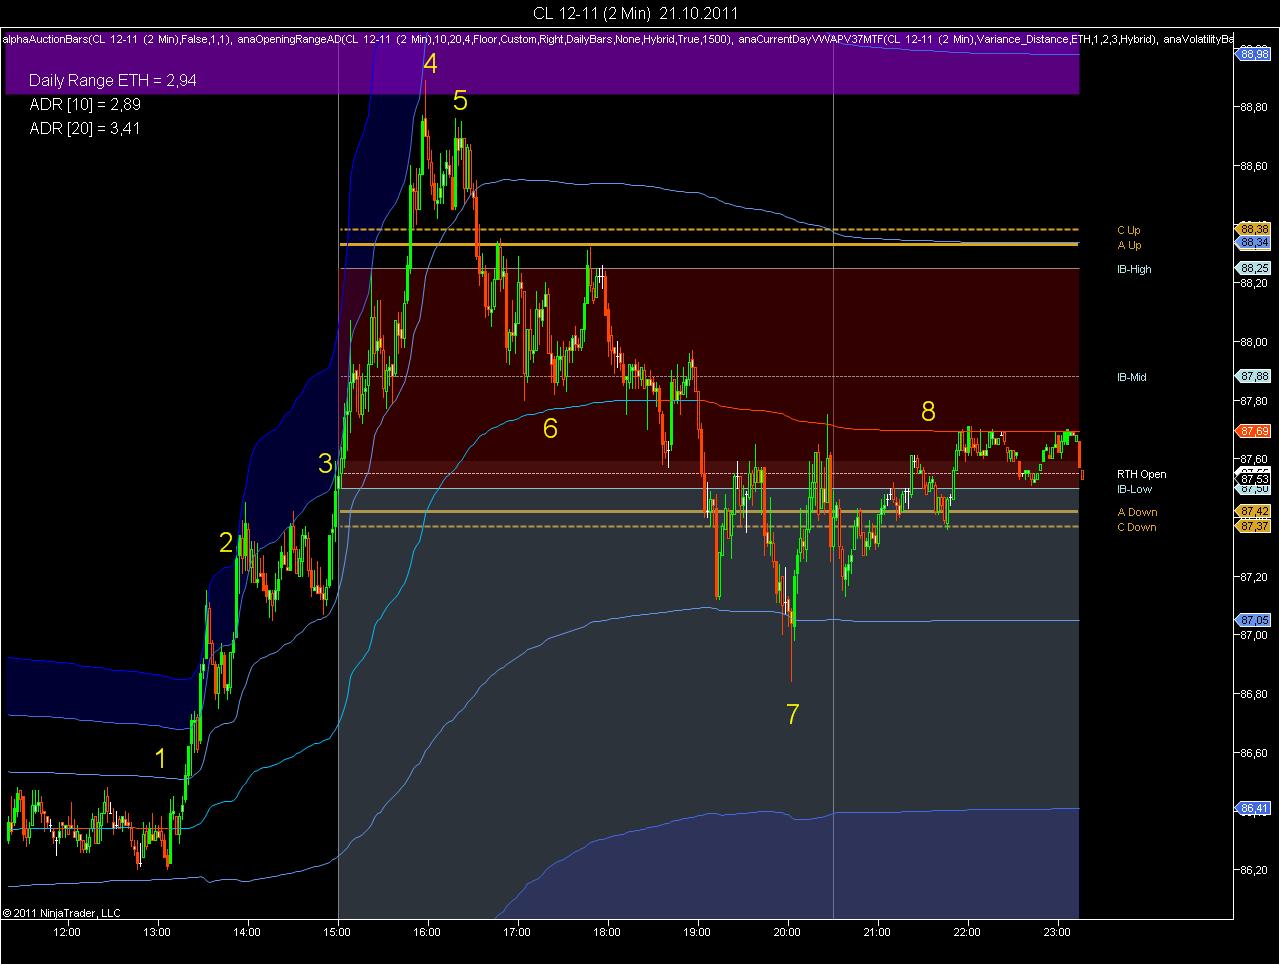
@mfbreakout: I have quite different values for the opening range and the AUp and ADown values!
I use a 45 min period for the opening range of CL. The upper limit of the opening range was 88.29, the lower end was 87.50.
The bears were weak as the pivot range had not being tested during the night session.
(1) The actual breakout to the upside occured around 7:00 AM EST about 2 hours prior to the opening of the regular session.
(2) The breakout was followed by a strong uptrend as price remained above the 1st standard deviation band of VWAP. The 3SD level was touched several times.
(3) Price opened at the high of the night session, well above the Pivot range, a case for the bulls.
(4) 30 minutes into the session the daily range target was reached
(5) The bulls show a clear sign of exhaustion, time for a reversal trade
(6) Price is supported by VWAP
(7) A spike at the 1SD band show that the bears were no longer in control.
(8) VWAP became resistance for the rest of the day.
Here is pivot tracker values for different instruments. Lower the value, higher the expected VOLATILITY. Other file shows first day of the month and 2nd half of the year reference points. These numbers keep me centered as after trading 300- 400 ticks intraday moves in crude futures , one can get disoriented after a week or so.
My older links are deleted after couple of days by the service , I was using. fat Tails showed me a new way of posting and they will be permanent. The charts from 10-21-11 post are active and will remain active.
I will try to re post old broken threads as i get some time.
1) Daily pivot range is from MF sheet. See attached file. I think difference in values can be due to different low, closing prices being used. Based on 10-21-2011 tight pivot ranges, pivot tracker value was 31 and it was underscored, which means shrinking pivot.
2) I use opening range from 8.30 am till 9.15 am US eastern time. I think, you are using pit open @ 9 am. I use A value= 8 ticks and C=13
Today's OR was 88.42 to 87.72. Thus A up= 88.50 and A down= 87.64.
On the attached daily pivot sheet, besides noting down daily pivot ranges, i look at $ risk for each instrument.