Welcome to NexusFi: the best trading community on the planet, with over 150,000 members Sign Up Now for Free
Genuine reviews from real traders, not fake reviews from stealth vendors
Quality education from leading professional traders
We are a friendly, helpful, and positive community
We do not tolerate rude behavior, trolling, or vendors advertising in posts
We are here to help, just let us know what you need
You'll need to register in order to view the content of the threads and start contributing to our community. It's free for basic access, or support us by becoming an Elite Member -- see if you qualify for a discount below.
-- Big Mike, Site Administrator
(If you already have an account, login at the top of the page)
Personally, I wouldn't pay too much attention to what stephenszpak has to say.
I read a long time ago about a successful trader that said he developed and used
certain indicators that worked. I think it was his mentor that told him that it wasn't
the indicators that worked but it was all the experience that he accumulated over
time as a trader that made him successful. That sounds reasonable to me.
One problem is that if you take a given instrument you'll see the amplitude and
period of the waves continuously change. So, of course, a 5 period simple works
and then it doesn't work, 6, 7, 8, and on and on. The same thing occurs if you use
just candles/bars. On a given day a 5 minute is great, but on another day a 15 minute.
Range bars and other charting that removes time (although it doesn't totally remove time)
seems to be better. Well, better on paper anyway. With range bars and such, you have
charting that shows the price moving reasonably soon to its move. If there is very little
movement there is no new candle/bar formed. A moving average crossover system will
often generate buys/sells during these times.
I thought about color coding range bars to add a time element a few days ago. It
probably has little value.
so we have two indicators in common. I use the dynamic fiblines since a long time. I have put them in the dwonload section. It is displayed in a slightly different version and hidden in my SessionPivots package. I also use Keltner Channels.
But I do not believe in this Universal Laws type of stuff. I have read a load of books and also scientific papers on fibs and markets. Fibs basically work as a self-fulfilling prophecy. Just as pivots. Lots of traders use them as reference points. No black magic or harmonic laws..
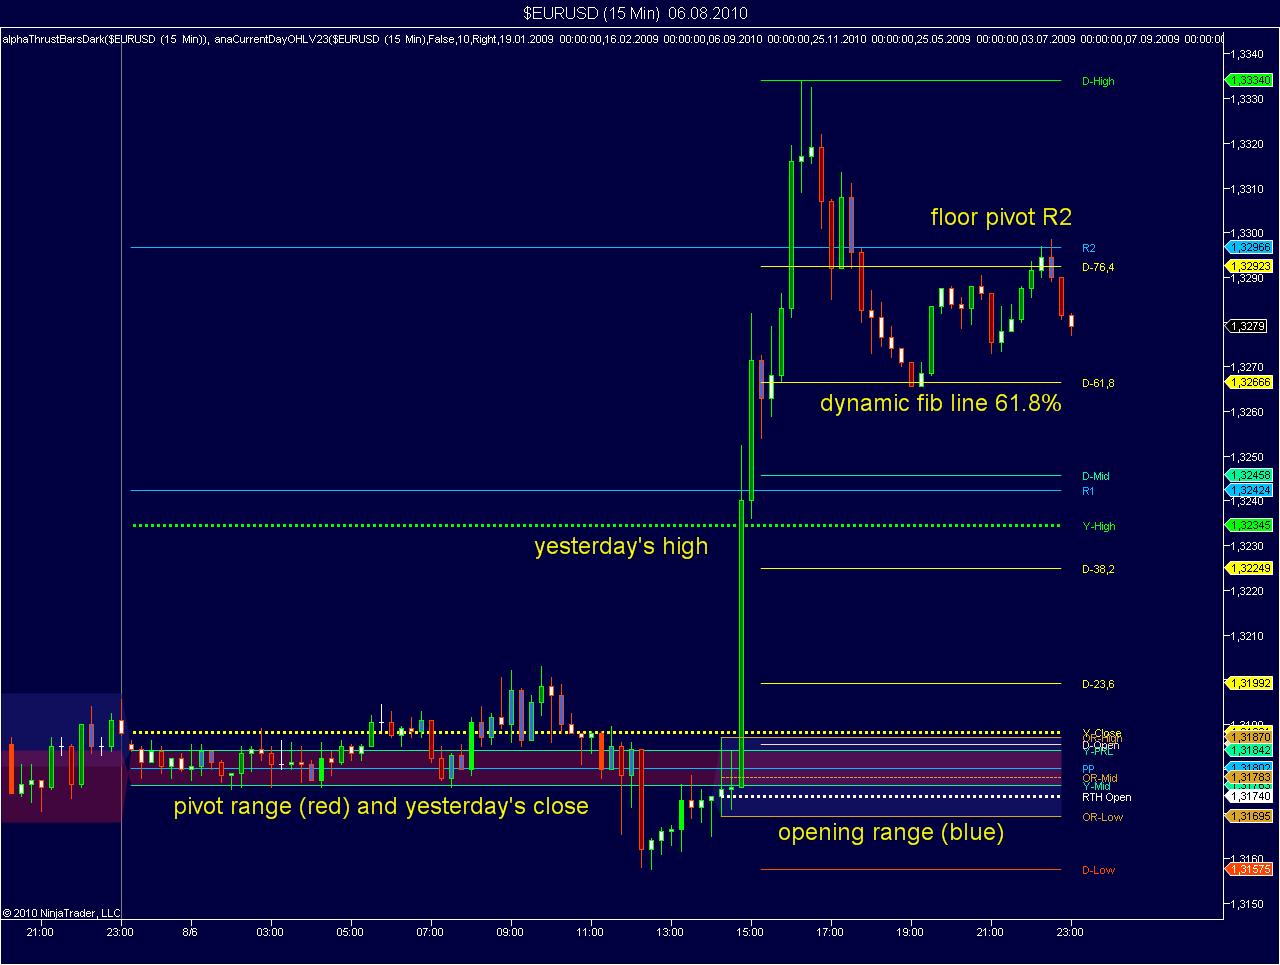
Below my chart with pivots and dynamic fib lines. The dynamic fib lines are only displayed as level on the right side of the chart.
FatTails
Do u enter, user defined values for Previous day, H, L, O and close into this session pivots everyday?
can u say what is the exact version of session pivots you use that displays fib and pivots.
1) to form a directional bias (what direction price *WANTS* to go now)
2) to find sweet spots where the risk:reward is skewed in my favor
3) to gauge momentum versus lack of conviction also strength versus weakness
4) to easily spot recurring behaviors that seem to repeat over and over in a systematic way
In short, i use indicators to form a frame of reference in order to analyse price action as if i was using a special pair of binoculars to see things i could not see otherwise:
I agree that experience is important. Trading is a game, and you need to practice in front of your screen. But then you need to evaluate your performance, write down your mistakes as well as your achievements, to feed back the experience into your behaviour. So it is well possible that you use indicators that do not work and that you are successful. Maybe you just have not found out, what made your success.
I use time in my trading. That is the reason that I do not use range bars. My trades are based on scenario, and if this is not validated after a specific time - say 2 candles -, I quit the trade. If I use range bars, no candle will show up, if the price goes nowhere, and no candle will tell me to get out!
Nope. Never use userdefined values. I use Kinetick EOD for daily data (first connection) and the pivot indicators are set to DailyBars mode. The last version I have published is SessionPivotsV23, can be found here
Exported using NT Version 7.0.1000.26
Indicators will only run on NT 7.0.1000.5 or later.
Family of 6 indicators to display daily, weekly and monthly pivots and OHL of current day, current week and current month. The package includes
- anaPivotsDailyV43
- …
It includes both the daily, weekly and monthly pivots and the dynamic fib lines. You also can adapt it to two day session (preset for ES, there are 5 two day sessions per year). There is a thread that explains the detailed use of this indicator, which is here
I am getting quite a number of messages and mails, how to configure the various pivot indicators, so I decided to post a brief summary and explain via a few examples, how to draw the pivots where you want them. I attach the SessionPivots indicators for …
The pivots indicator on the chart is V24, which is work in progress and includes the pivot range.
Fat Tails, I have to agree with you regarding self-fulfilling prophecy, especially when you consider where the fibonacci trading language is most widely used, at the dealer level. You might replace the word lots in 'lots of traders' with the phrase biggest and best.
I read publications coming off the desks of currency strategy heads at several major houses and fib is the language of choice, in the fx market anyway. Considering that 4 houses control about 80% of the daily cash market flow, it's easy to see how these levels, however they are expressed, become real points of support and resistance where institutional clients of the dealers park huge stops and limits.
You hit the nail on its head! It is a fad that works as long as it works. But trading is no science, it is a game. And not all of the rules are fixed. So the fads and the rules undergo evolutionary change. Things that worked yesterday, may not work tomorrow.
Fibonacci levels are similar to floor levels, seen from within an elevator. It is an option to quit.
If you have one or more things that work for you that's great, seriously.
I spent more time looking at charts than I'm going to confess to, and I made little if
any headway in understanding what was going to happen next. I could dissect a chart after
the fact, but there is no gold in that.
Sometimes looking back (on the YM or DOW) lets say the previous day, and the day before, and
the day before (P, PP, PPP) one can see support/resistance levels.
The attachment enclosed if of the Dow. If one looks at the first candle one can see that support was
found at the close, because that's where the price stops going down. The next day if one was to
assume logical price action within the candle, one can assume prices went down farther, then came
back up to what is now a resistance level and broke through, and of course closed on the high.
SO if one had these 2 candles to look at...
since if broke through the resistance level it is now a support level, with the third candle from the
left holding at that level. It closed lower on that day, but it closed on the support made the previous day.
Unfortunately trades don't come out of the books in real life. This is a text book scenario. I haven't
been paying close attention to this thread, so maybe all this has been covered.
Mate, I guess these are daily candles OK? - look at it, it opened and traded DOWN DOWN DOWN all through the session, and closed very near the lows. Support has left the building bro! Add to that what was going on in the fundamental scene and I gotta say it seems crazy to call the low/close of that candle as support.
I reckon don't **** around trying to pick where the next support/resistance will be, just take your chances at where it was. simples :-)